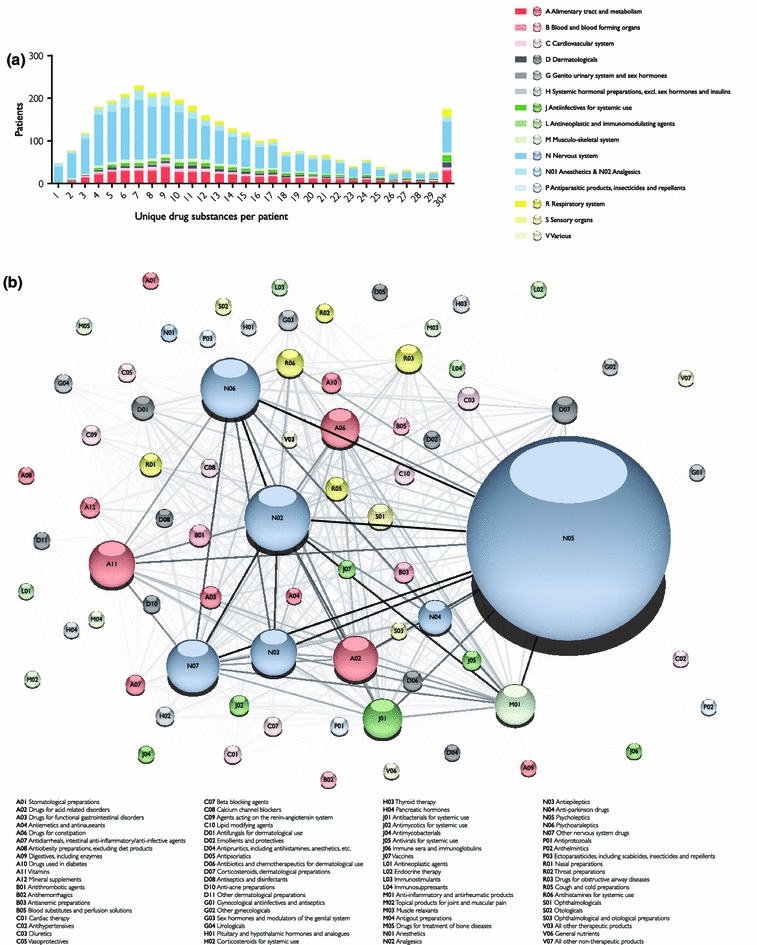
Fig. 2.

Patient population. a Distribution of unique recorded drug substance prescriptions per patient and average proportions of first-level ATC group prescription. The total number of drug substances prescribed to a patient throughout the study (x-axis) and the proportions of drug classes prescribed to the patients prescribed this number of drug substances (y-axis). Anesthetics (N01) and analgesics (N02) are separated from nervous system (N), permitting illustration of psychiatric drug prescription. b Within-patient drug prescription between second-level ATC groups. Nodes represent the second-level ATC, sizes, the amount prescribed and colour of the anatomical main group. Edges show within-patient drug prescription between second-level ATC groups, while darker edges indicate more frequent co-administration or within-patient prescription. ATC Anatomical Therapeutic Chemical
