
Fig. 4.
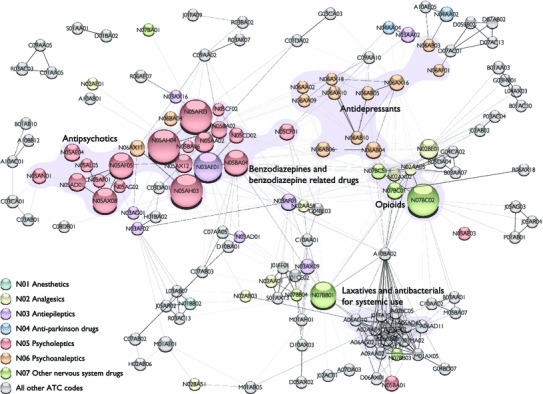
ADR-profile network. Condensed force-directed ADR-profile network, represented by the 500 largest Jaccard similarity coefficient values. Nodes depict drug substances, identified by the fifth-level ATC code, sizes indicate the number of ADRs detected. Subgroups of the ATC group Nervous system (N), are given separate colours, except for grey, which symbolises all other drug substances. Edges display ADR profile similarity, while darker edge indicates higher similarity. ADR adverse drug reaction, ATC Anatomical Therapeutic Chemical classification system