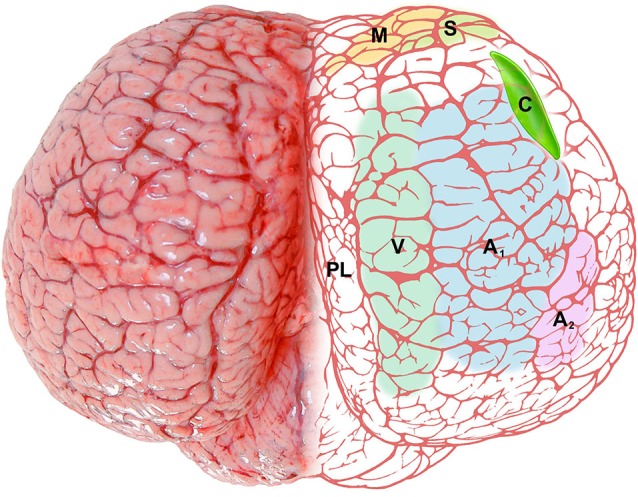
Figure 6.

Schematic representation of the claustrum (C, bright green) of the bottlenose dolphin shown through the dorsal aspect of the brain. The pale colors on the right side represent functional areas of the cortex: M (yellow), motor cortex; S (green), somatosensory cortex; V (gray-green), visual cortex; A1 (pale blue), primary auditory cortex; A2 (pale pink), secondary auditory cortex; PL (no color), paralimbic lobe.
