
Figure 3.
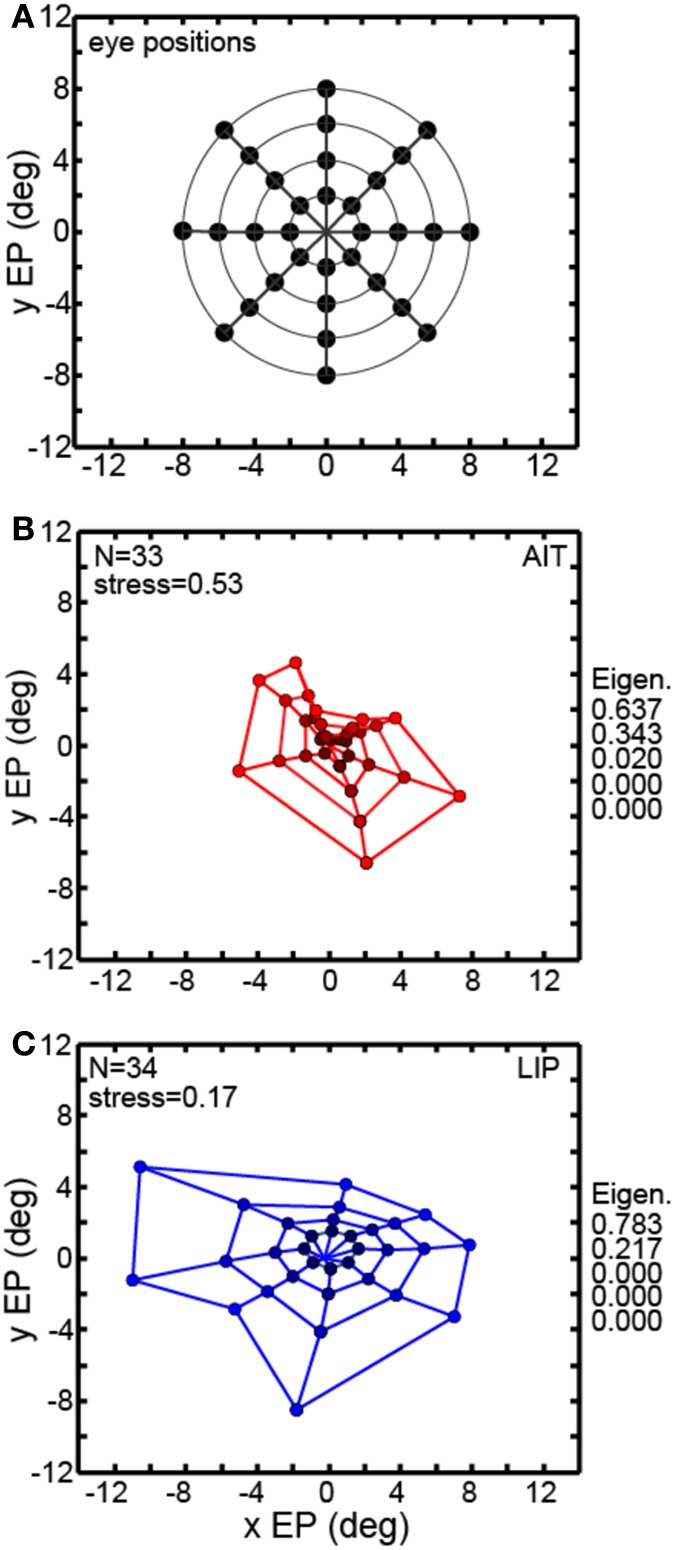
Recovery of eye positions from neural population activity, using a global stimulus configuration and multidimensional scaling (MDS) analysis. MDS analysis was based on using interpolated neural responses from recorded neurons that had significant spatial selectivity under ANOVA. This analysis used mean neural response across trials. (A) Set of eye positions used as input configuration for MDS analysis. It consisted of 32 points arranged in a polar grid. The center of the grid corresponded to central fixation. As illustrated, the eye positions were arranged over four eccentricities with visual angles of [2°, 4°, 6°, 8°]. At each eccentricity, eight locations were arranged in an iso-centric circle at 45° polar angle increments. Each of the 32 eye positions produced a different activation pattern (response vector) in the population of neurons in our data set. Lines connecting the positions merely help illustrate iso-eccentricity positions and iso-polar angles as well as highlight the overall symmetry of the spatial configuration. (B) Configuration of eye positions recovered from AIT data, shown in red. (C) Configuration of eye positions recovered from LIP data, shown in blue. There is less distortion apparent in the spatial layout of the LIP grid compared to AIT and the LIP stress value is lower than in AIT, indicating a more accurate global recovery of eye positions. For both panels (A) and (B), color darkens with decreasing eccentricity, to aid visualization. Also for both panels, normalized MDS eigenvalues are displayed.