
Figure 5.
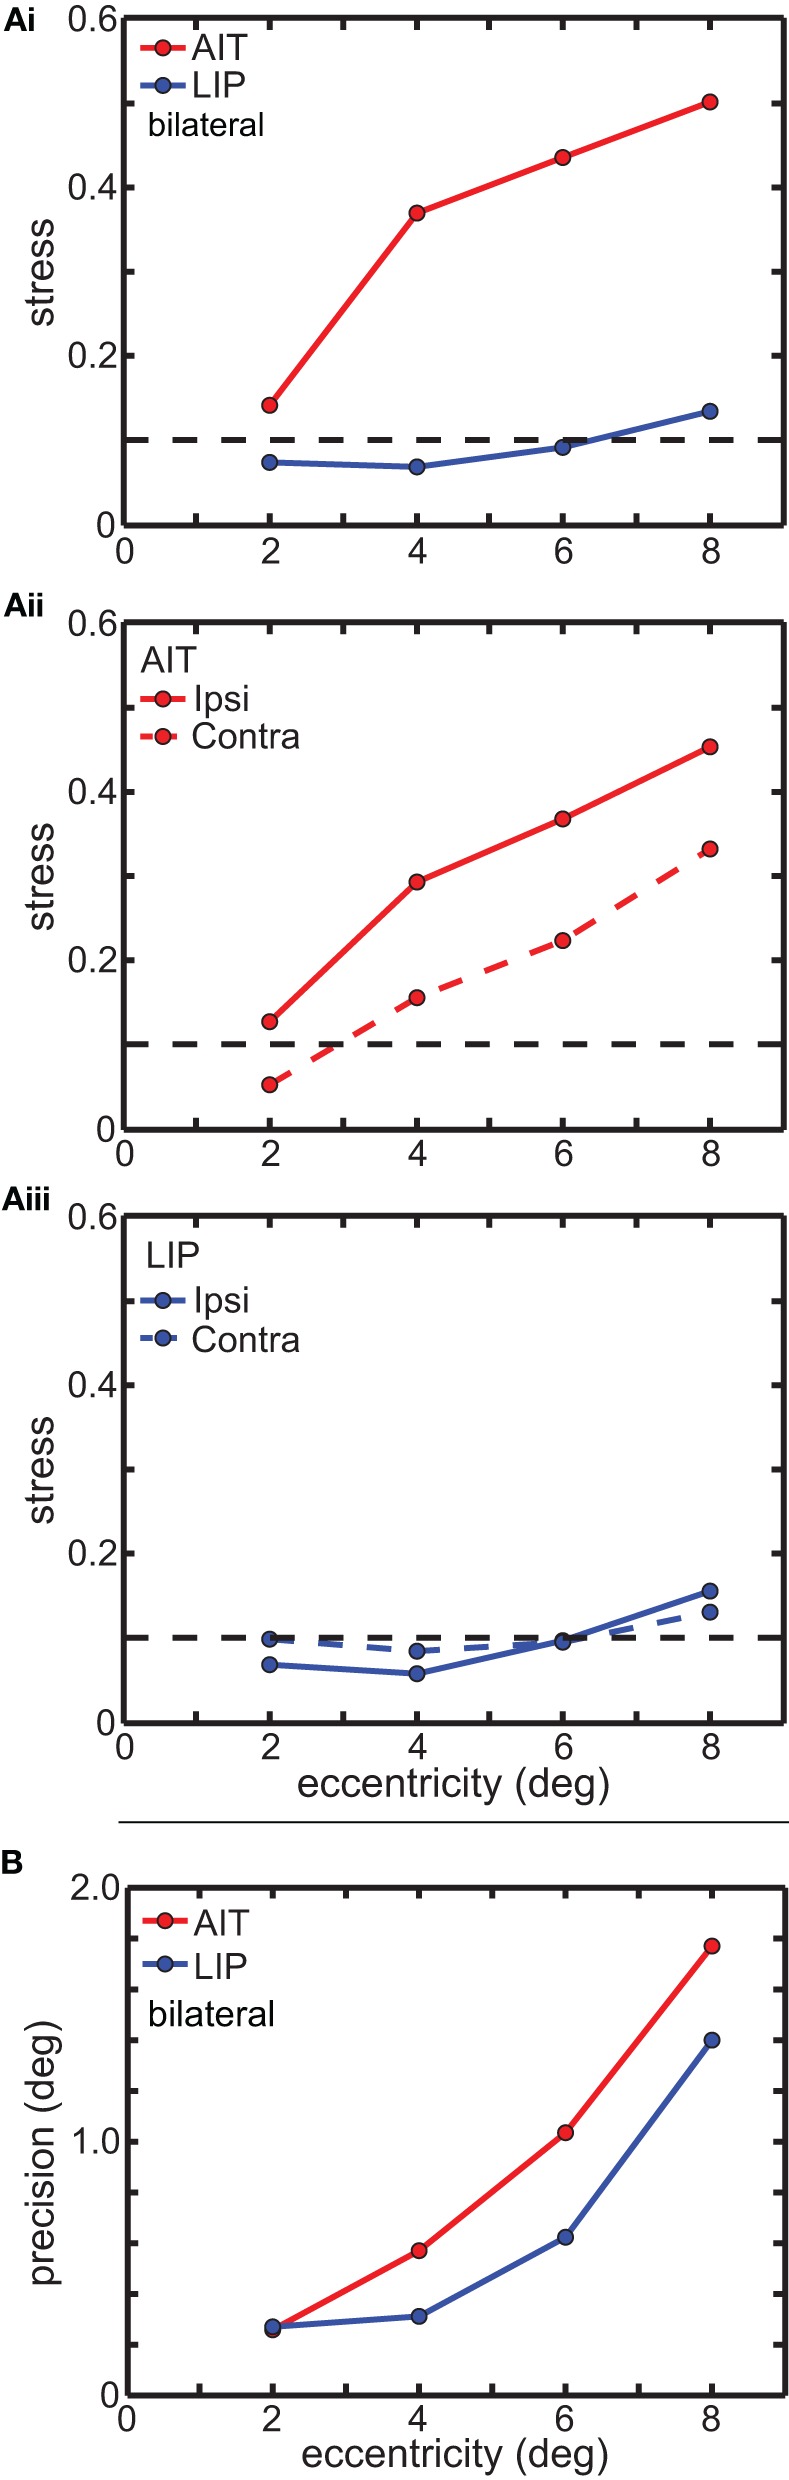
Global and local error measures for multidimensional scaling analysis (MDS) results in Figure 3. (A) Global error (stress) as a function of stimulus eccentricity. Stress values below 0.1 (dashed line in each panel) indicate highly accurate spatial representations. (Ai) Comparison of stress in AIT and LIP using bilateral (ipsilateral and contralateral) data. (Aii) Stress for AIT representations for ipsilateral and contralateral eye positions. (Aiii) Stress for LIP representations for ipsilateral and contralateral eye positions. (B) Local error (precision) as a function of stimulus eccentricity for both AIT (red points) and LIP (blue points). Precision is the standard deviation of recovered eye position, as determined by bootstrap resampling of the data. Precision was individually calculated for each eye position in Figures 3B (AIT) and 3C (LIP), and then for each area averaged over all eye positions having the same eccentricity.