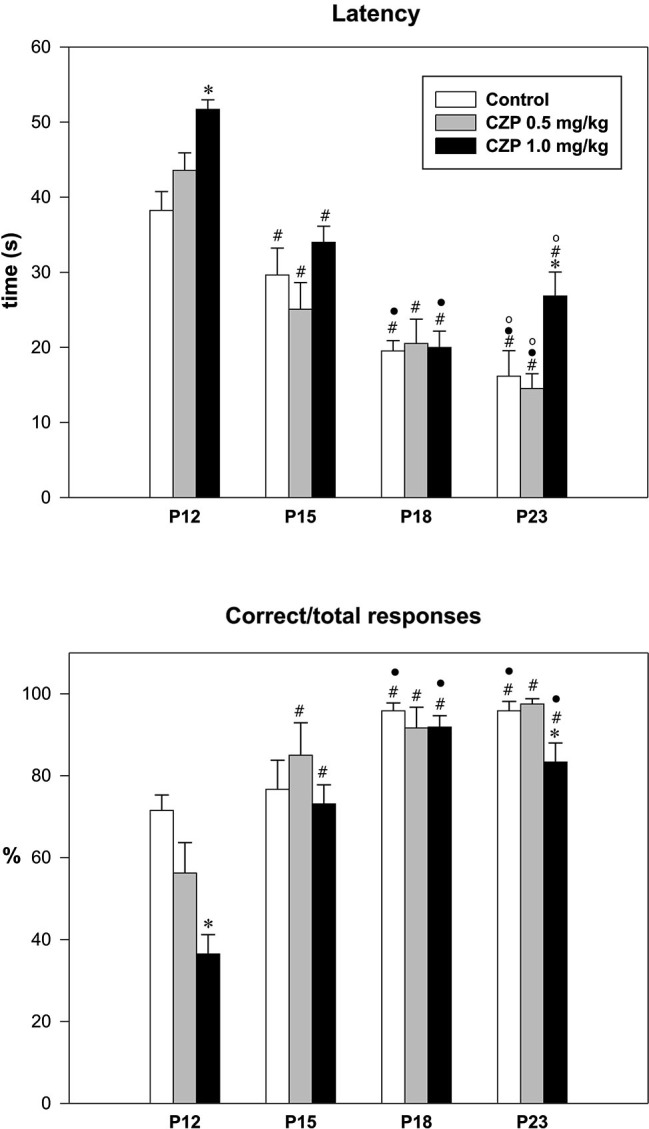
Figure 3.

Effects of CZP exposure on HR. Upper graph—latency to reach home part of the cage; lower graph—ratio of correct to total responses. Abscissae: four age groups. Ordinate for the upper graph: time in seconds. Ordinate for the lower graph: percentage of correct responses. For individual doses, see inset. * Significant difference compared to an appropriate control group, # significant difference compared to P12 animals, • significant difference compared to P15 and º significant difference compared to P18 animals.
