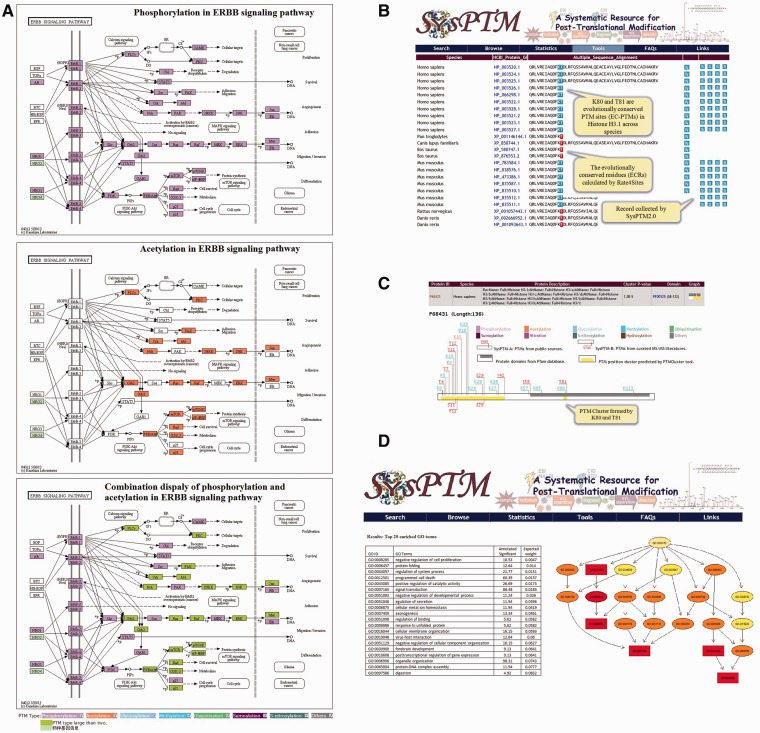
Figure 3.
Analysis tools and their enhanced functions in SysPTM2.0. (A) Exploration of ERBB signaling pathway regulated by phosphorylation and acetylation in both individual and combinatorial manners. PTMs on pathways are colored by mapping user-queried proteins into the KEGG reference pathways. Each color indicates a specified PTM type, e.g. purple denotes phosphorylation, orange denotes acetylation, green box indicates the presence of multiple modifications in one protein; (B) PTMPhylog searching result of human H31 protein (P68431). ECRs calculated by Rate4Sites are represented with red background, and EC-PTMs are colored with blue background; (C) PTM cluster result of human H31 (P68431) calculated from PTMCluster. The known PTM site clusters can be queried by either keywords or protein sequences at PTMCluster. User can also upload or define PTM sites to calculate site clusters in a real-time manner. Protein domains are shown in gray and site clusters are shown by yellow. PTM sites contained in the cluster are marked in the upper and lower sides of the protein box (upper: PTM sites from SysPTM-A, lower: PTM sites from SysPTM-B); (D) The top 20 enriched GO terms identified by PTMGO using human proteome acetylation data in (57). The top enriched GO terms were identified by the elim algorithm. Rectangles indicate the most significant terms. Color represents the relative significance, ranging from dark red (most significant) to bright yellow (least significant). The GO identifier is displayed for each node.

