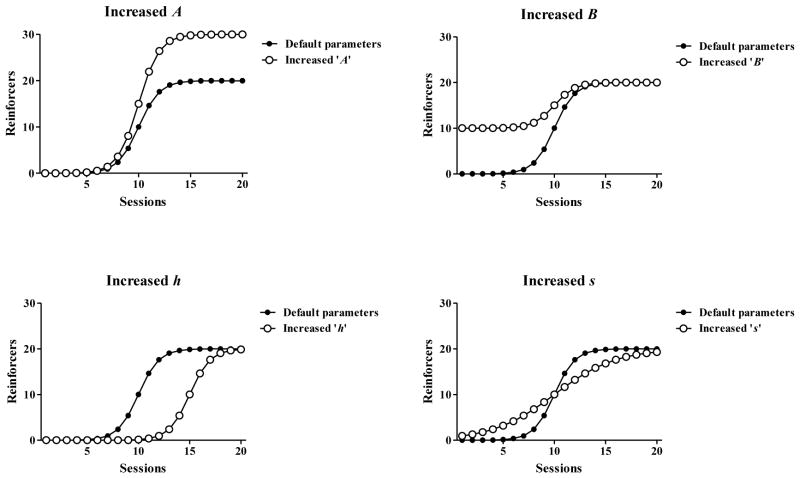
Figure 1.
Theoretical parameter fluctuations in the logistic function. The example logistic function is shown using the black symbols with A = 20 reinforcers (asymptote), B = 0 reinforcers (baseline), h = 10 sessions (half-life of the acquisition process) and s = 1 session (slope), where R is the number of nicotine reinforcers collected at each day t. The open symbols show changes in the example function as a result of selective changes in parameter values. The ‘Increased A’ graph depicts the function when the asymptote parameter is increased from 20 to 30 reinforcers, ‘Increased B’ depicts a baseline parameter increase from 0 to 10 reinforcers, ‘Increased h’ depicts an increase in mid-acquisition day from 10 to 15 sessions, and the ‘Increased s’ depicts a threefold increase in slope (1/s).

