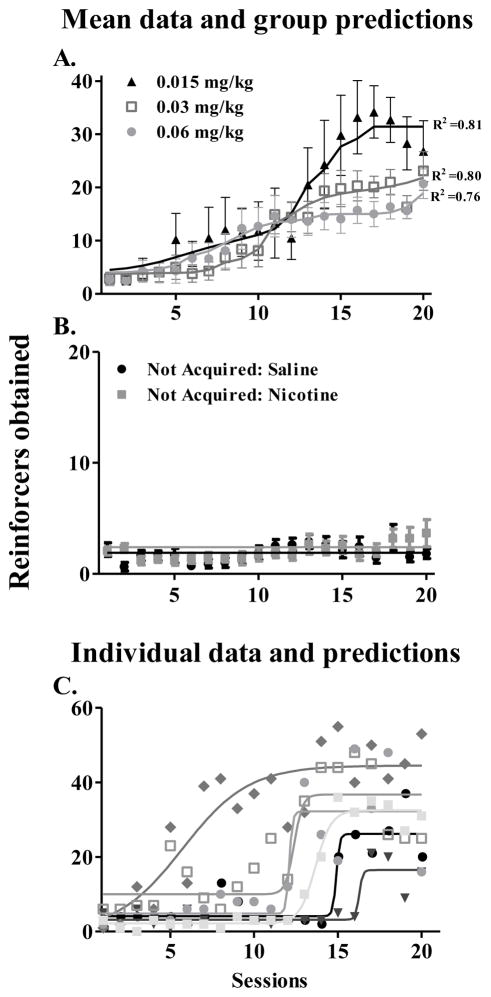
Figure 3.
Mean reinforcers obtained (± SEM) by animals that acquired nicotine self-administration in each dose group (A), animals that had not acquired pooled from nicotine dose groups and all saline animals (B), and individual data from animals that acquired in the 0.015 mg/kg dose group (C) across the 20 training sessions. Continuous lines shown in A are average fitted traces of the selected logistic model (Equation 2), which held B constant and let A and h vary across doses. As anticipated, a dose-dependent effect was obtained on the asymptotic number of reinforcers obtained, which was greater for the lowest dose, followed by the medium and high doses. Goodness-of-fit of the model to each dose-group data is shown by R2 values. Continuous lines shown in B are fitted traces of the selected constant function (Equation 1) indicating no systematic change from baseline. All saline animals failed to acquire self-administration. Data from any of the nicotine groups that had failed to acquire nicotine self-administration (Not Acquired) did not differ from saline animals. Continuous lines shown in C are fitted traces of the selected logistic model to individual self-administration data for rats that acquired in the 0.015 mg/kg dose group to illustrate the relationship of the raw individual data to model predictions.

