
Fig. 1.
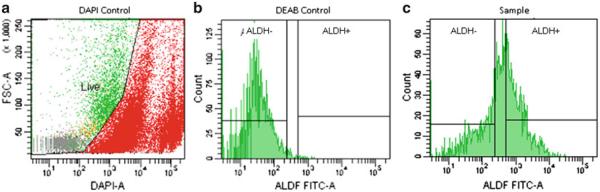
FACS ALDEFLUOR histogram depicting (a) suggested DAPI control separating live and dead populations of cells, (b) DEAB (negative) control utilized in the ALDEFLUOR assay, and (c) example analysis of a sample for ALDH+ and ALDH− fractions.
Official websites use .gov
A
.gov website belongs to an official
government organization in the United States.
Secure .gov websites use HTTPS
A lock (
) or https:// means you've safely
connected to the .gov website. Share sensitive
information only on official, secure websites.
FACS ALDEFLUOR histogram depicting (a) suggested DAPI control separating live and dead populations of cells, (b) DEAB (negative) control utilized in the ALDEFLUOR assay, and (c) example analysis of a sample for ALDH+ and ALDH− fractions.