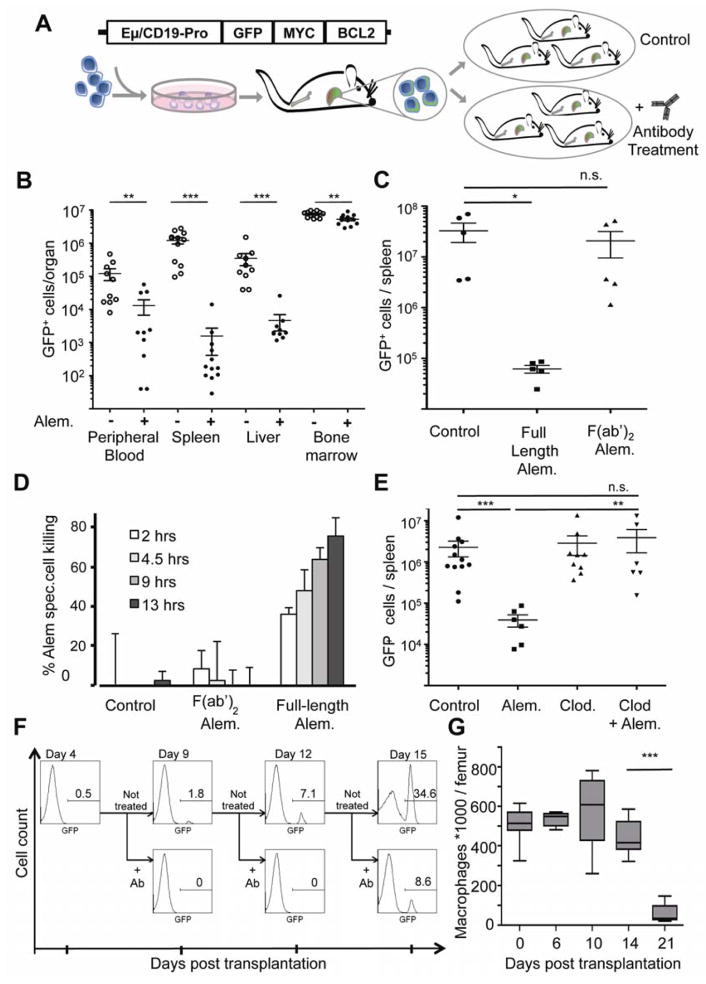
Figure 1. The bone marrow provides a resistant niche that protects leukemia cells from antibody-directed macrophage engulfment.
(A) A schematic of the humanized hMB-model of double-hit lymphoma. Cord-blood-derived HSCs are infected with a B-cell directed BCL2/MYC overexpressing construct. Primary leukemias are transplanted to secondary recipient mice for further treatment studies. (B) A graph showing the relative tumor burden in distinct organs 8 days after initiating alemtuzumab treatment. Each symbol represents one mouse. For bone marrow, the total number of tumor cells in both femurs and tibias was counted. (C) A graph comparing the anti-tumor effect of the full-length and the F(ab′)2 fragment of alemtuzumab in NSG mice after 7 days of treatment. Each symbol represents one mouse. (D) A graph showing the relative macrophage-dependent cell death in the presence or absence of antibody. (E) A graph showing the relative tumor cell number following treatment with or without clodronate and alemtuzumab. GFP+ leukemic cells in the spleen were quantified after 7 days of treatment. (F) Histograms showing the percentage of hCD45+/ GFP+ cells in the bone marrow. Secondary hMB recipient mice were treated at the indicated times after leukemia cell transplantation, and the presence of GFP+ leukemic cells was assayed on day 9, 12 or 15, respectively. (G) A graph showing the time dependent abundance of CD11b+/GR1lo/CD11c−/F4/80+ macrophages in femurs of hMB mice by flow cytometry. For all bar graphs, average and SEM are shown (* = p<0.05, ** = p<0.01, and *** = p<0.001). See also Figure S1 and Movie S1.

