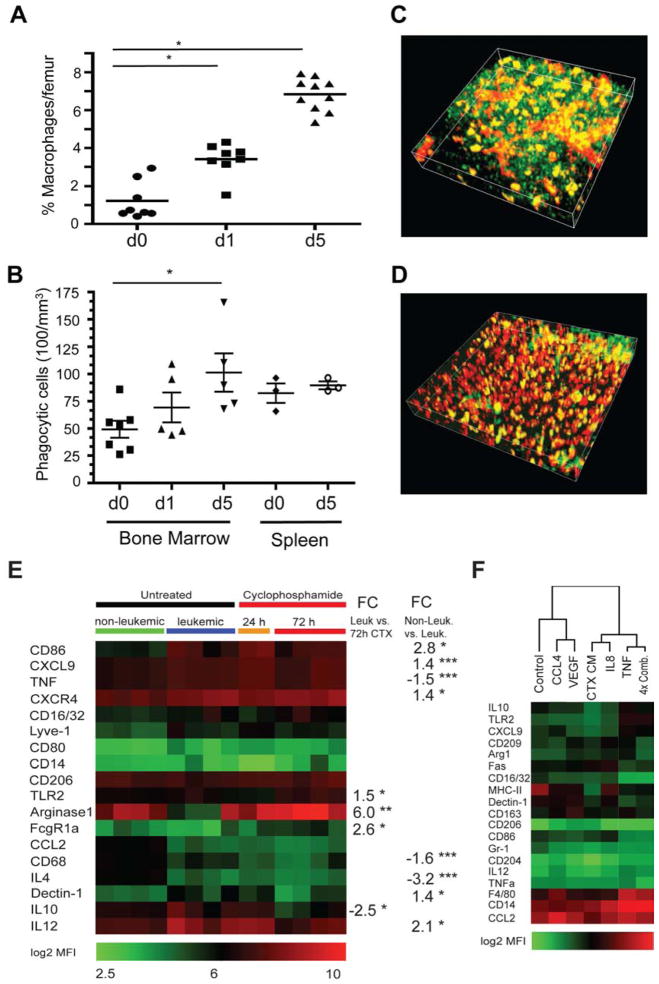
Figure 5. CTX increases macrophage frequency and shows time-dependent synergy with antibody therapy.
(A) Flow cytometry quantification of the number of bone marrow macrophages after CTX treatment, as assessed by CD11b+/GR1lo/CD11c−/F4/80+ staining. (B) A graph showing the number of phagocytic cells in the bone marrow following treatment with 100 mg/kg CTX. Phagocytic cells were quantified by automated identification of TexasRed-positive cells using IMARIS software package. (C and D) Representative three-dimensional reconstruction of (C) untreated bone marrow and (D) bone marrow 5 days post CTX treatment. Green cells indicate leukemic GFP+ cells, while phagocytic cells harboring dextran-TexasRed uptake are displayed in red (* = p<0.05). See also Figure S4. (E) A heat map showing macrophage marker expression, expressed as mean fluorescence intensities (MFIs), from control (non-leukemic) mice, untreated leukemic mice and CTX-treated leukemic mice (24h and 72h post treatment onset). Significant changes in marker expression are indicated to the right of the heat map. (F) A heat map showing marker expression in peritoneal macrophages cultivated in the presence of conditioned media generated from CTX-treated leukemia cells, recombinant CCL4, VEGF, TNFα, or IL8 or a combination of all 4 recombinant factors. Marker expression was obtained by flow cytometry and displayed as MFIs. Clustering of experimental conditions was performed using a Pearson correlation (* = p<0.05, ** = p<0.01 and *** = p<0.001).

