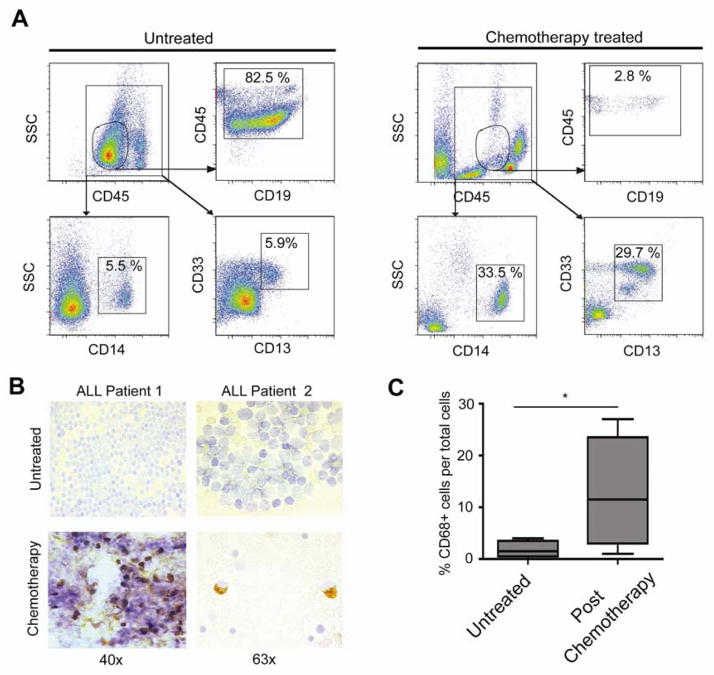
Figure 7. Polychemotherapy induces macrophage infiltration in ALL patients.
(A) Flow cytometry assessment of bone marrow aspirates taken from a patient at diagnosis (left panels) and undergoing CTX-containing polychemotherapy (GMALL Induction I) at d11 post treatment start (right panels). The circular CD45+/CD19+ gate shows the number of lymphocytic blasts. In the rectangular CD45+ gate, the CD14+ and CD13+/ CD33+ cells demarcate the bone marrow macrophage populations. (B) Representative immunostaining for CD68 in bone marrow smears prior therapy (upper panels) and at d11 post therapy onset (lower panel). (C) A graph showing the percentage of CD68+ macrophages per total cells in bone marrow smears from 6 ALL patients prior to therapy and at day 11 of the first treatment cycle (* = p<0.05).

