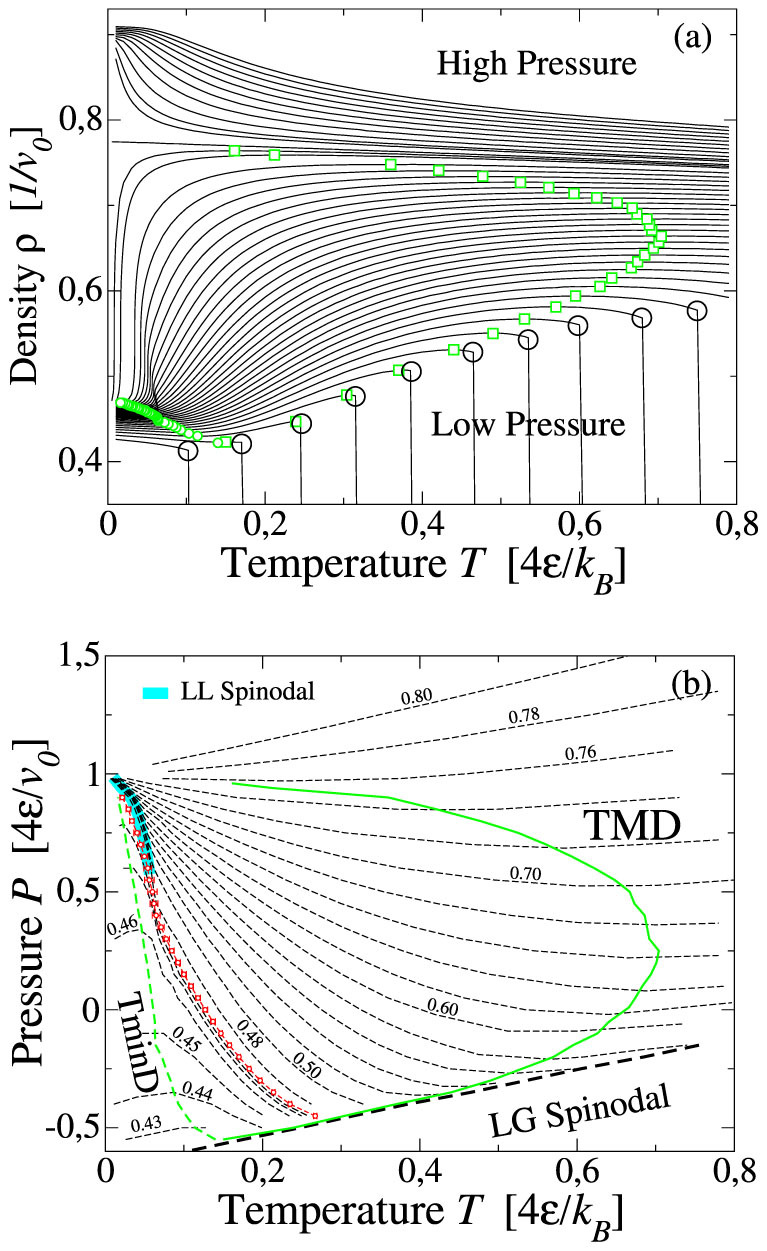
Figure 2.

(a) Isobaric density variation for 104 water molecule. Lines join simulated state points (~ 150 for each isobar). P increases from −0.5 (bottom curve) to 1.5  (top curve). Along each isobar we locate the maximum ρ (green squares at high T) and the minimum ρ (green small circles at low T) and the liquid-gas spinodal (open large circles at low P). (b) Loci of TMD, TminD, liquid-gas spinodal and liquid-liquid spinodal in T − P plane. Dashed lines with labels represent the isochores of the system from ρv0 = 0.43 (bottom) to ρv0 = 0.80 (top). Dashed lines without labels represent intermediate isochores. TMD and TminD correspond to the loci of minima and maxima, respectively, along isochores in the T − P plane. We estimate the critical isochore at ρv0 ~ 0.47 (red circles). All the isochores with 0.47 < ρv0 < 0.76 intersect with the critical isochore for
  along the LL spinodal (tick turquoise) line.
