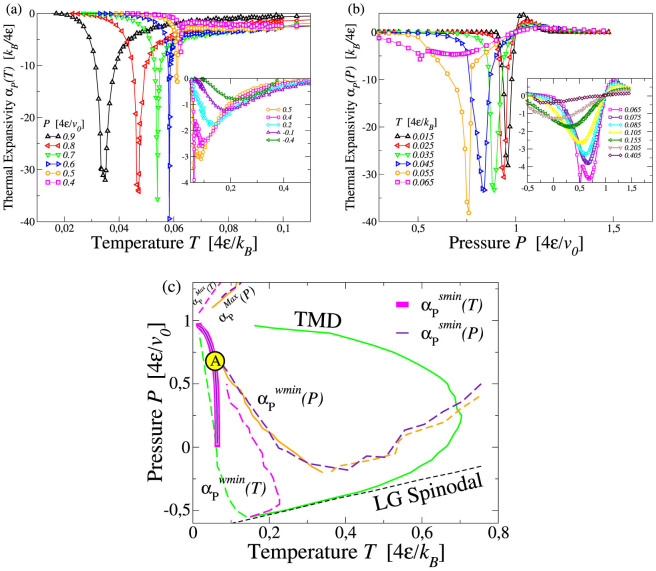
Figure 5.
(a) Loci of strong minima of ( ) and weak minima (
 in the inset) along isobars for αP. (b) Loci of strong minima (
 ) and weak extrema (
 and
and  in the inset) along isotherms. (c) Projection of αP extrema in T − P plane. Orange lines are the loci of weaker extrema
  and
and  . The large circle with A identifies the region where the divergent minimum in αP is observed. Symbols not explained here are as in Fig. 2.

