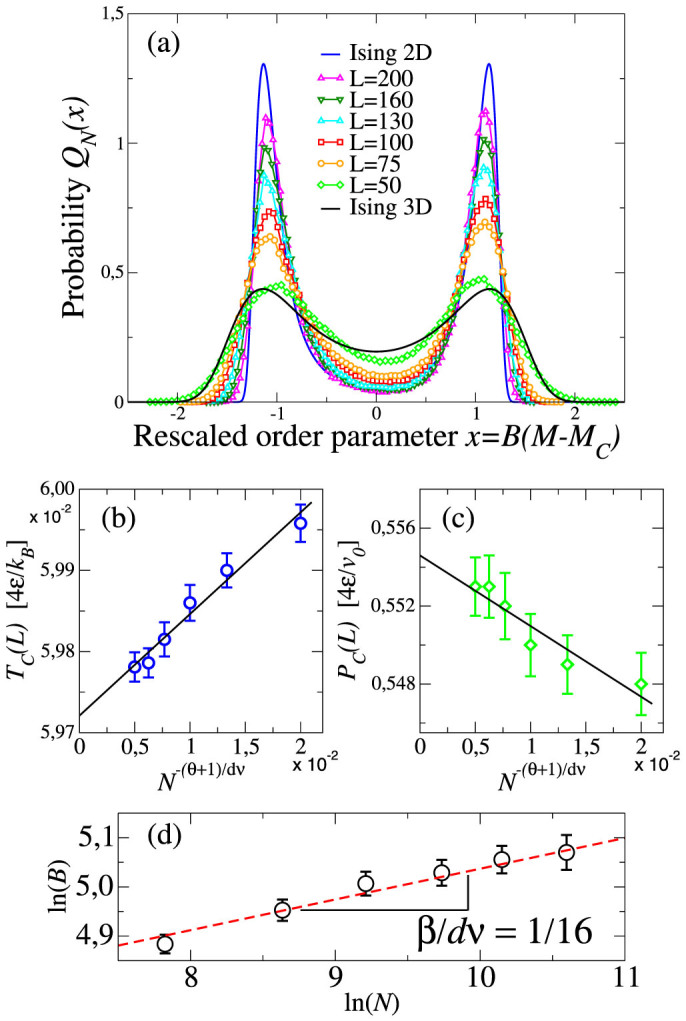
Figure 7.

(a) The size-dependent probability distribution QN for the rescaled o.p. x, calculated for Tc(N), Pc(N) and B(N), has a symmetric shape that approaches continuously (from N = 2500, symbols at the top at x = 0, to N = 40000, symbols at the bottom) the limiting form for the 2D Ising universality class (full blue line) and differs from the 3D Ising universality class case (full black line). Error bars are smaller than the symbols size. (b) The size-dependent LLCP temperature Tc(N) and (c) pressure Pc(N) (symbols), resulting from our best-fit of QN, extrapolate to  and
and  , respectively, following the expected linear behaviors (lines). (d) The normalization factor B(N) (symbols) follows the power law function (dashed line) ∝ Nβ/dν. We use the d = 2 Ising critical exponents: θ = 2 (correction to scaling), ν = 1 and β = 1/8 (both defined in the text).
