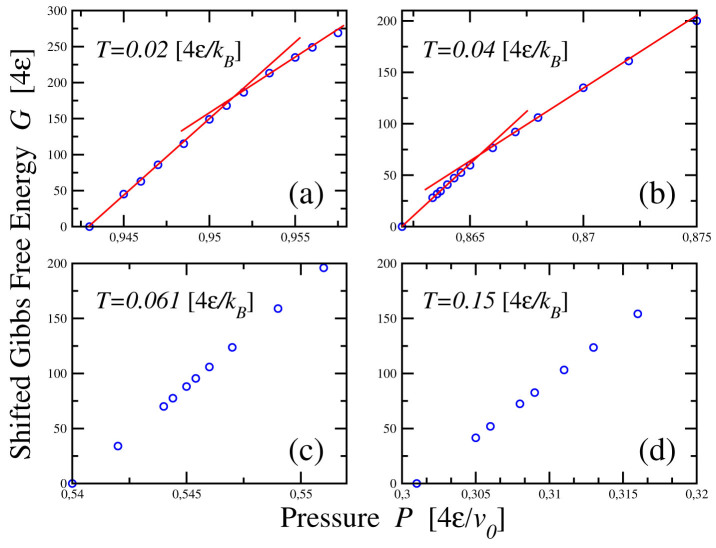
Figure 9. Gibbs free energy G along isotherms, as function of P. Points are shifted so that G = 0 at the lowest P. Lines are guides for the eyes.
(a) For  there is a discontinuity in the P-derivative of G at
  as expected at the LLPT, consistent with the behavior of the response functions at this state point (e.g., in Fig. 3b, 4b). (b) For
  we observe the discontinuity in the P-derivative at
  , again consistent with the LLPT. The LDL has a lower chemical potential (μ ≡ G/N) than the HDL, μLDL < μHDL, due to the HB energy gain in the LDL. For
  (c) and for
  (d), both larger than Tc, we instead do not observe any discontinuity in the P-derivative of G by crossing the locus of
  and the locus of
  , respectively, as expected in the one-phase region.

