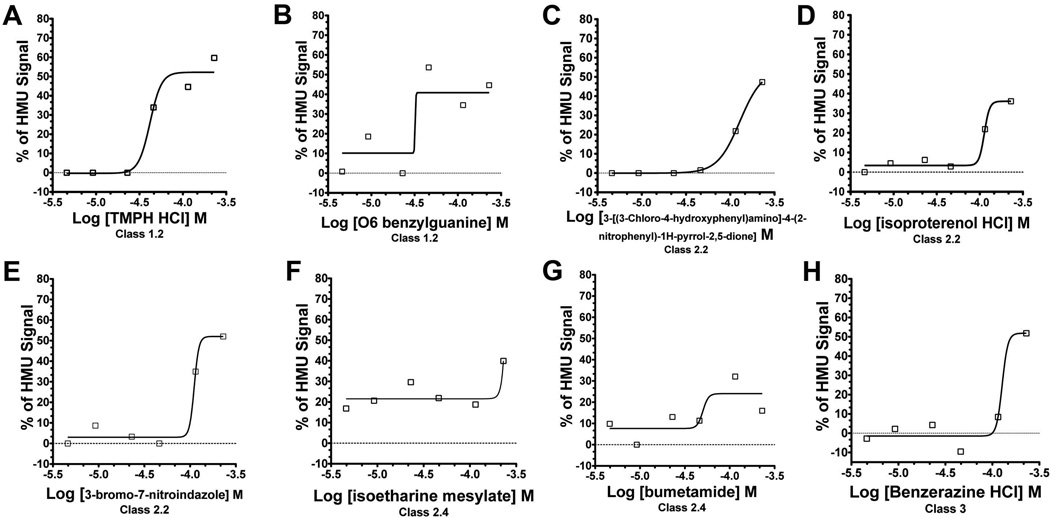
Figure 5. The concentration-response curve analysis from the GALC quantitative HTS assay against LOPAC library.
In the cell-based HTS for GALC using LOPAC concentrations ranging 4.6 - 230 µM, 19 small molecules (SMs) presented active concentration-response curves (CRCs). For each SM, a CRC is produced by the percentages of HMU signal increase (y axis) as a function of the different SM concentrations (x axis) used to treat the GLD patient fibroblasts. Two small molecules showed CRCs of class 1 (complete curves; high and partial efficacies): TMPH HCl (SM-1) – class 1.2 (A) and O6 benzylguanine (SM-2) – class 1.4 (B). Seven small molecules showed CRCs curve of class 2.2 (partial curve; r2≥0.9; efficacy≤80%) and three of them are shown: 3-[(3-Chloro-4-hydroxyphenyl)amino]-4-(2-nitrophenyl)-1H-pyrrol-2,5-dione (SM-3;C); isoproterenol HCl (SM-4; D); 3-bromo-7-nitroindazole (SM-7; E). Four other SMs presented class 2.4 CRCs (partial curve; r2≤0.9; efficacy Min.-80%): including isoetharine mesylate (SM-12; F) and bumetamide (SM-13; G). Six molecules presented class 3 CRCs characterized by “single-point of activity”. Benzerazine HCl (SM-14; H) is one of the SMs showing class 3 CRCs.

