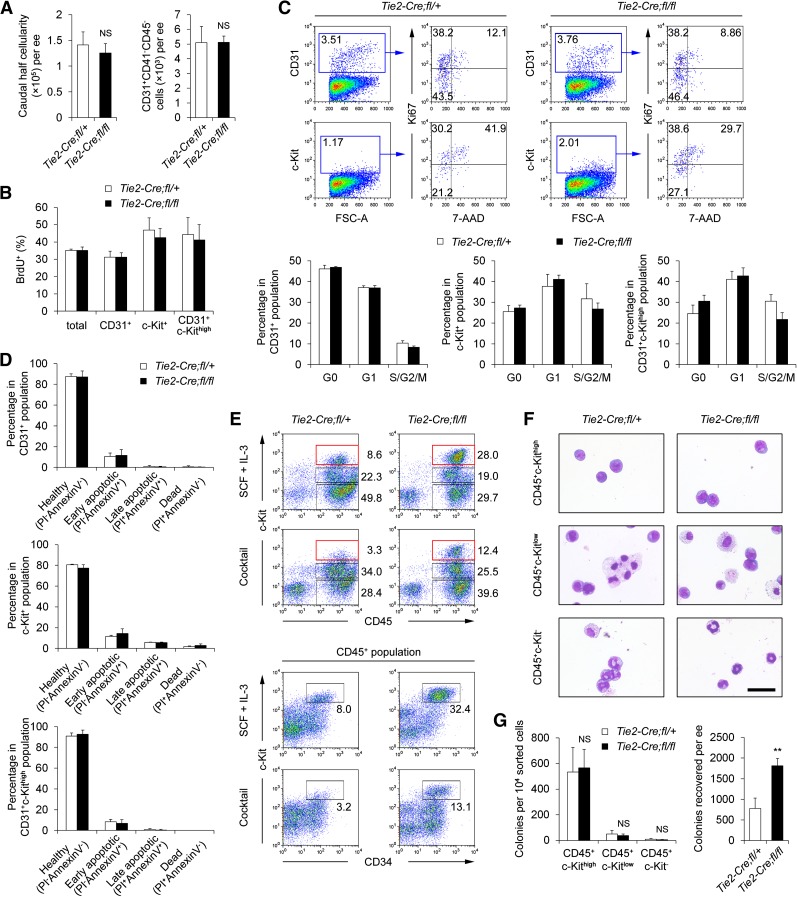
Figure 2.
Increased hemogenesis in Tie2-Cre;Smad4fl/fl embryos is not due to abnormal hematopoietic proliferation, survival, or differentiation. (A) Graphs showing the absolute numbers of total cells (left) and CD31+CD41−CD45− endothelial cells (right) in the caudal half of Tie2-Cre;Smad4fl/fl and control embryos (n = 3). (B) Graph showing the percentage of BrdU+ cells within different subpopulations of the caudal half determined by FACS analysis (n = 3). No increase was detected in the Smad4 mutants as compared with the control embryos. (C) Representative FACS analysis of Ki67/7-AAD fluorescence in the CD31+ or c-Kit+ populations of the caudal half of Tie2-Cre;Smad4fl/fl and control embryos (upper). Graphs to the lower showing the cell cycle status within different subpopulations of the caudal half determined by FACS analysis of Ki67/7-AAD fluorescence (n = 4). (D) Graphs showing the apoptotic status within different subpopulations of the caudal half determined by FACS analysis of Annexin V/PI fluorescence (n = 5). No difference was detected in the Smad4 mutants as compared with the control embryos in all the groups. (E) Tie2+ cells from the caudal half of Tie2-Cre;Smad4fl/fl and control embryos were cultured on OP9 for 7 to 9 days. Representative FACS analysis of cells generated in the cultures is shown. (F) Morphologic analysis of the sorted populations generated from Tie2+ caudal half cells in the OP9-DL1 coculture. Cytospin preparations are stained with May-Grunwald/Giemsa. Scale bar: 40 μm. (G) Graph to the left showing the frequencies of CFU-Cs in the individual sorted populations generated from Tie2+ caudal half cells in the OP9-DL1 coculture. Graph to the right showing the total number of CFU-Cs recovered from the OP9-DL1 coculture (n = 4). Data are mean ± standard deviation. NS, not significant. **P < .01.

