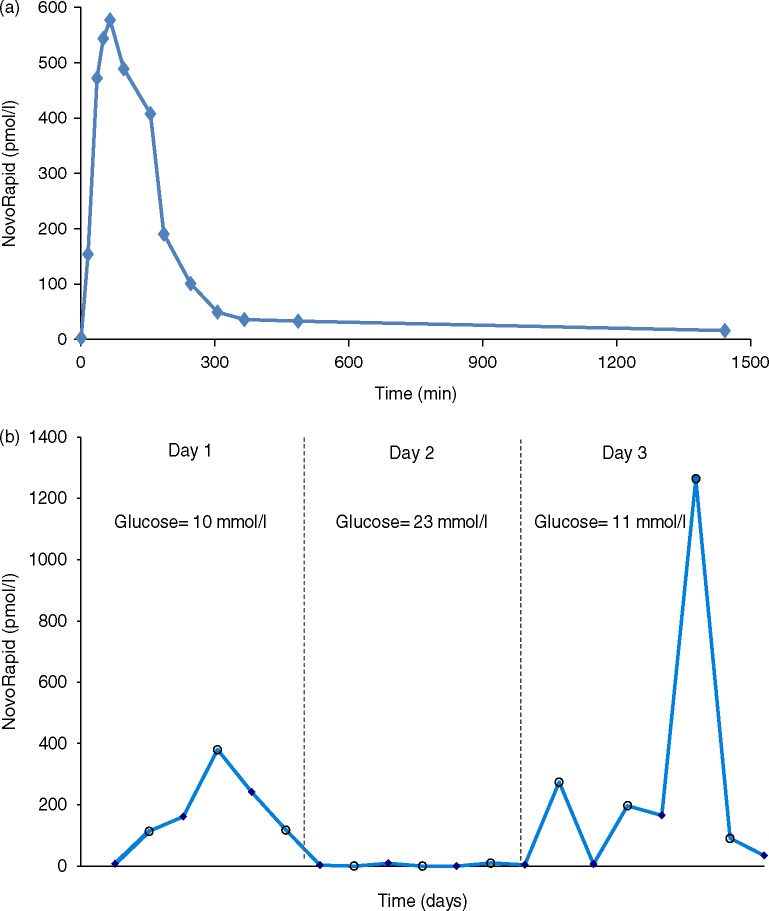
Figure 4.
(a and b) The insulin analogue, NovoRapid, concentration in the patient's circulation during 24 h tissue resistance test (a) and during a prolonged test duration (b). The solid circle in (b) represents the insulin level before insulin injection. The open circle represents the insulin level after insulin injection. NovoRapid of 20 units was injected in the 24 h test and 10 U were injected after each meal in the 3 days duration test. NovoRapid of 10 U is equivalent to 300 pmol/l. The glucose levels documented are the average glucose concentrations on each of the 3 days.

 This work is licensed under a