
Figure 4.
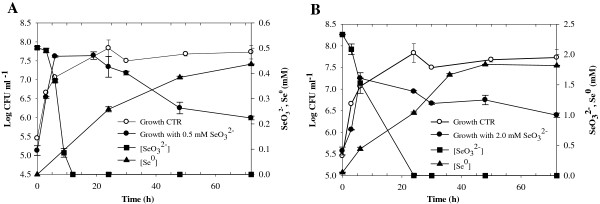
Time courses of bacterial growth, SeO32− depletion, and Se0 formation by B. mycoides SeITE01, in presence of (A) 0.5, and (B) 2.0 mM SeO32−. Each curve shows means based on the results of three experiments. Minor ticks (5-hours range) are inserted in the Time axis.