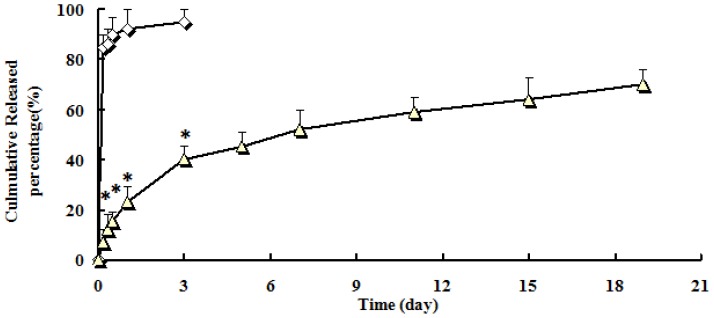
Figure 3.
In vitro release profiles of DTX-loaded microspheres from three batches. Release experiments were carried out in PBS (phosphate buffer solution) (pH 7.4), at 37 ± 0.5 °C. Each point represents the mean value of three different experiments ± S.D. ⋄: DTX injection; △: DTX-loaded microspheres. * p < 0.05: DTX-loaded microspheres (△) vs. DTX injection (⋄).

