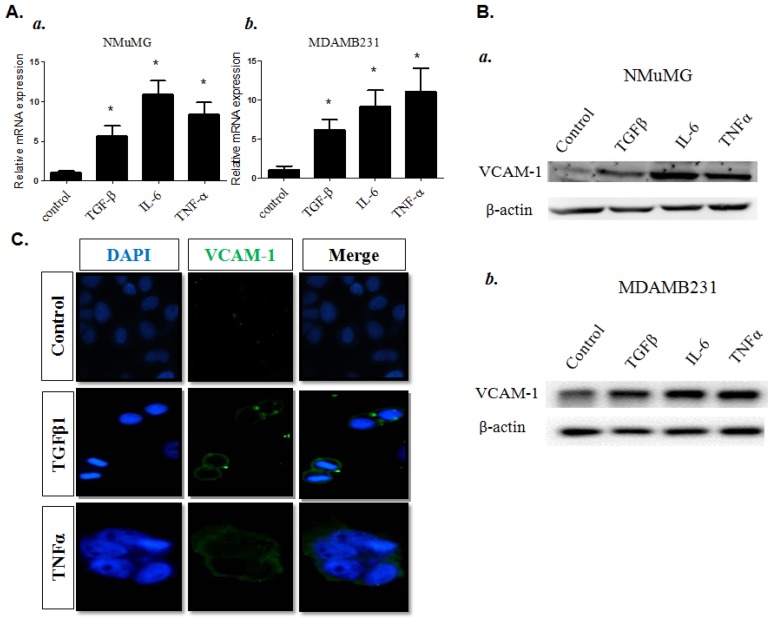
Figure 2.
(A) RT-qPCR analysis for VCAM-1 mRNA expression in a, NMuMG and b, MDAMB231 cells after treatment with control (1× PBS), TGFβ (5 ng/mL), TNFα (10 ng/mL), or IL-6 (1 ng/mL) overnight. Columns, mean of triplicate samples; bars, SE. * p < 0.01; (B) VCAM-1 protein expression in a, NMuMG and b, MDAMB231 cells by western blotting; (C) IF staining for VCAM-1 expression in MDAMB231 cells with or without cytokine treatments. DNA was visualized with DAPI staining.

