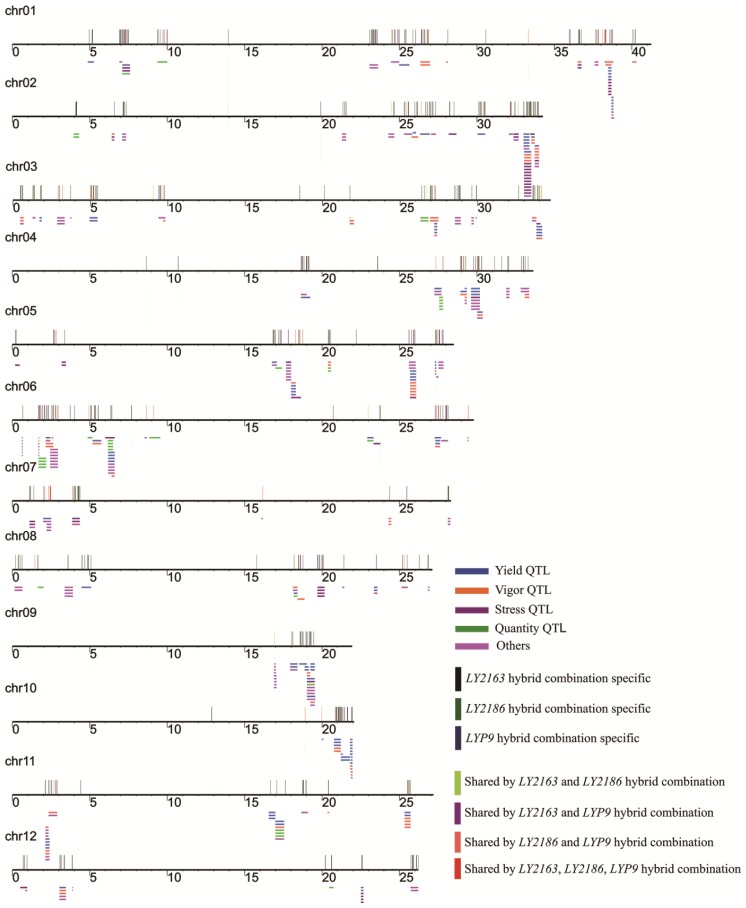
Figure 6.
Distribution of DGs among QTLs of a small interval. QTLs in Gramene (number of harbored genes ≤ 100) and harbored DGs were aligned to the Michigan State University (MSU) Rice Genome Release 6.1. The long horizontal line represents 12 chromosomes of the rice genome; the short horizontal lines represent the QTL span, and short vertical lines represent DGs.

