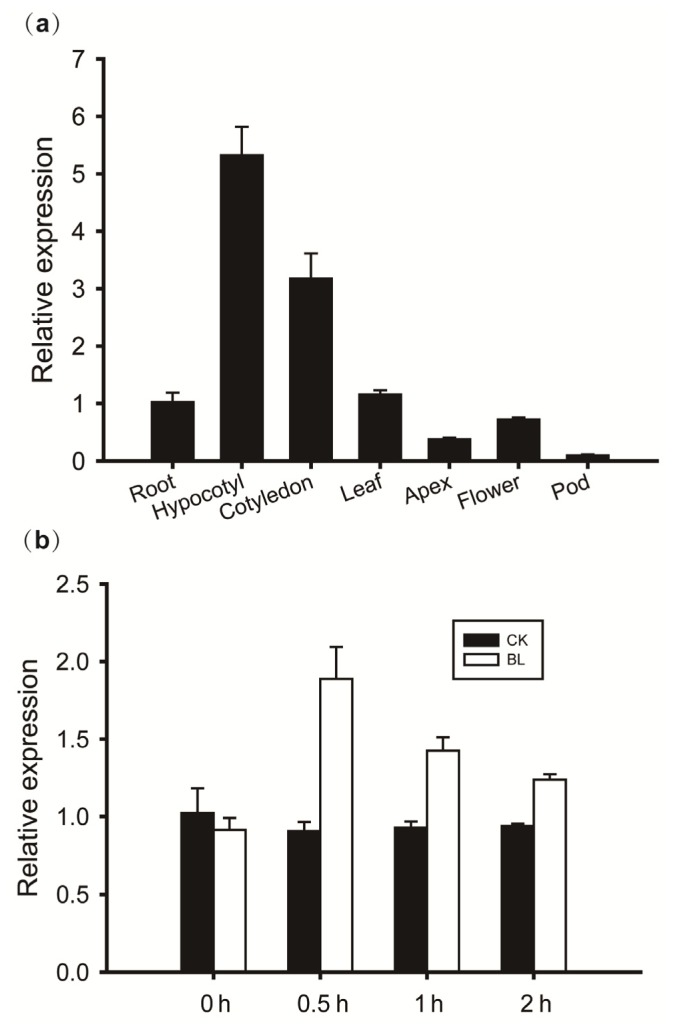
Figure 7.
(a) qRT-PCR analysis of GmBRI1 mRNA in different tissues of soybean cv. Williams 82. The sampling time of each tissue is described in Section 4.3. The relative expression levels are normalized to GmELF (GenBank accession No. NM_001249608). The data represent the mean ± SE of three independent experiments; and (b) The inducible expression of GmBRI1 in the leaves of Williams 82 under BR treatment. CK, untreated group (black column); BR, treated group (white column). The x-axis represents the time of the treatment: 0 h (before treatment), 0.5 h (treated for 0.5 h), 1 h (treated for 1 h) and 2 h (treated for 2 h). The relative expression levels are normalized to GmG6PDH (GenBank accession No. XM_003547631). The data represent the mean ± SE of three independent experiments.

