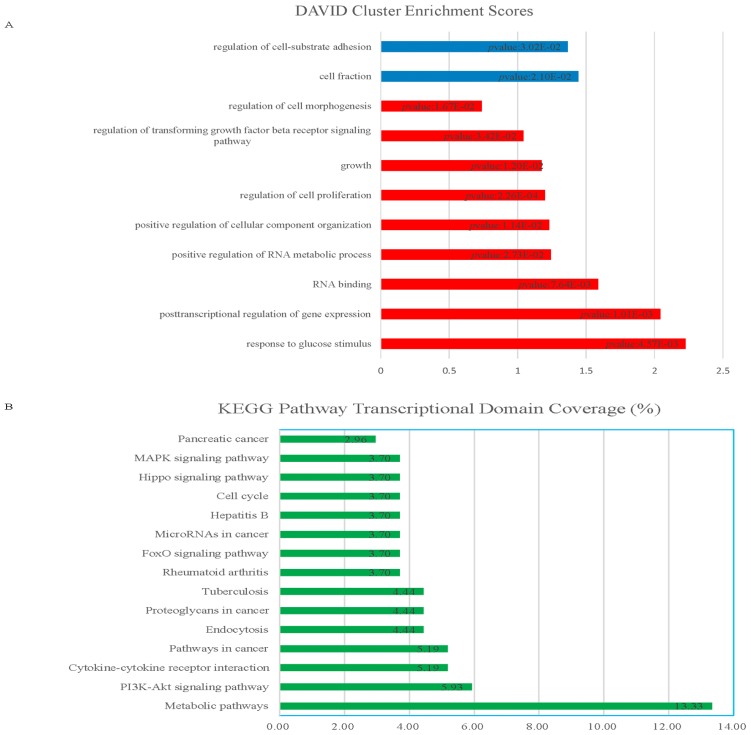
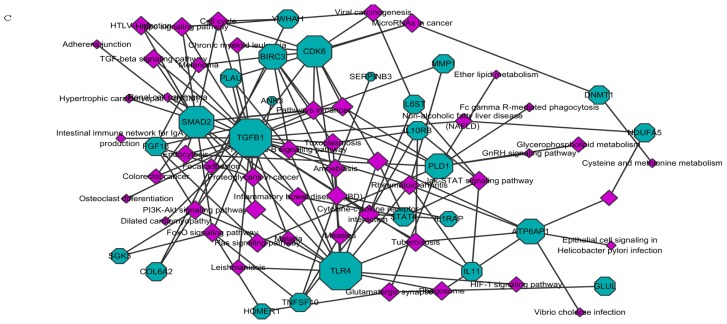
Figure 2.
Bioinformatics analysis of HOTAIR loss in Bel-7402 HCC cell line. (A) Gene ontology analysis of HOTAIR knockdown microarray data using the DAVID program. Red bars represent the top hits for upregulated genes. Blue bars represent the top hits for downregulated genes. DAVID enrichment scores are represented with Benjamini-Hochberg-adjusted p values. All error bars in this figure are mean ± S.E.M.; (B) KEGG pathway analysis of HOTAIR knockdown microarray data. Green bars represent the percentage of transcriptional domain coverage; and (C) mRNA-signaling pathway integrated network based on the predicted interactions (partial).


