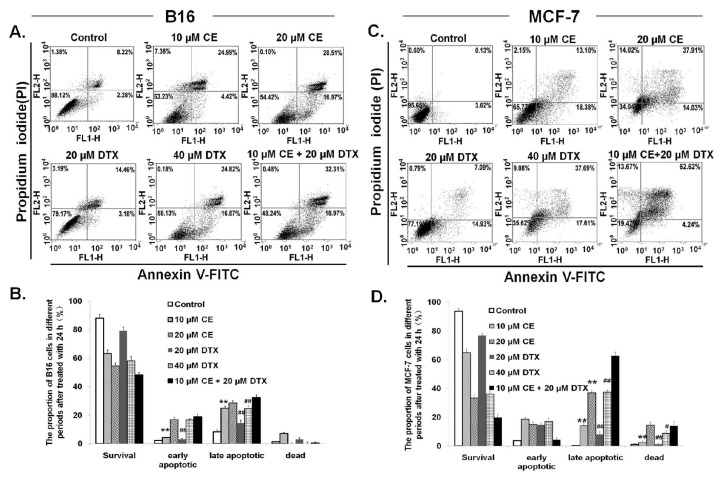
Figure 3.
Induction of apoptosis caused by CE + DTX on B16 and MCF-7 cells (n = 3). Cells were treated with either CE (10 or 20 μM), DTX (20 or 40 μM), or CE + DTX (10 μM CE plus 20 μM DTX) for 24 h incubation, while 0.3% DMSO-PBS served as control. (A,C) Representative dot-plots illustrating apoptotic status on B16 and MCF-7 cells; (B,D) Data summary and analysis of the proportion of B16 and MCF-7 cells in different periods was according to the results of flow cytometric analysis. ** p < 0.01, statistically significant difference between CE and CE + DTX; # p < 0.05, ## p < 0.01, statistically significant difference between DTX and CE + DTX.

