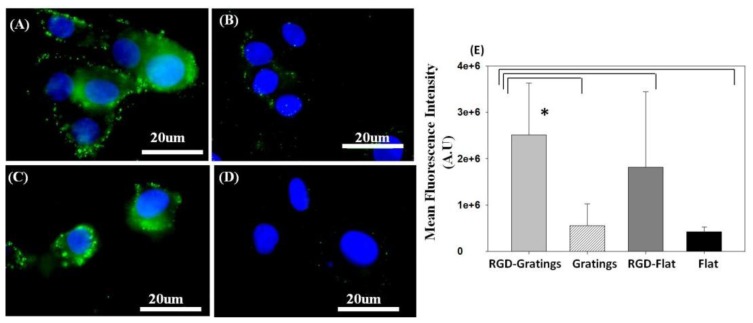
Figure 3.
Immunofluorescence staining of the hepatic protein, transferrin (green excitation λ = 448 nm), and nucleus (blue) in HepG2 cells cultured on (A) RGD TiO2-nanograting pattern; and (B) TiO2-nanograting pattern compared to cells cultured on (C) RGD-flat surface and (D) Flat alone (control); (E) Relative mean fluorescence intensity calculated using ImageJ for HepG2 cultured on various biofunctionalized TiO2 substrates. * Statistical significance at (p < 0.05).

