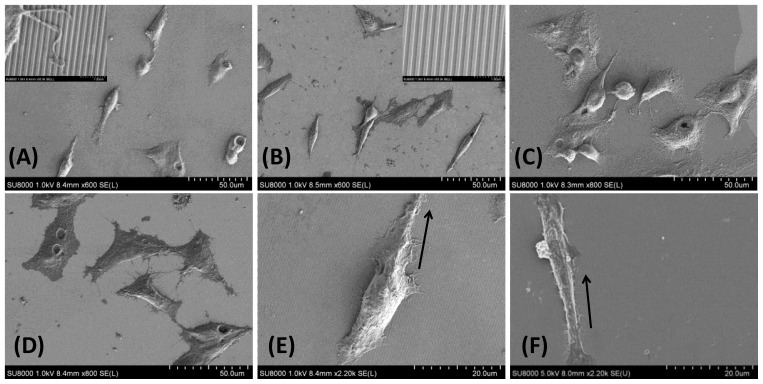
Figure 6.
SEM images of HepG2 cells cultured for 12 hrs in (A) RGD-TiO2 nanogratings compared to (B) TiO2 nanopattern alone and (C) RGD-TiO2 flat surface (D) flat surface alone (Control), insets are higher magnification SEM images that show the direction of nanogratings and the cell alignments parallel to TiO2 lines. Furthermore, the increase in cell width where indicated in (E) RGD-TiO2 and (F) nanogratings alone while black arrow indicate the direction of nanogratings.

