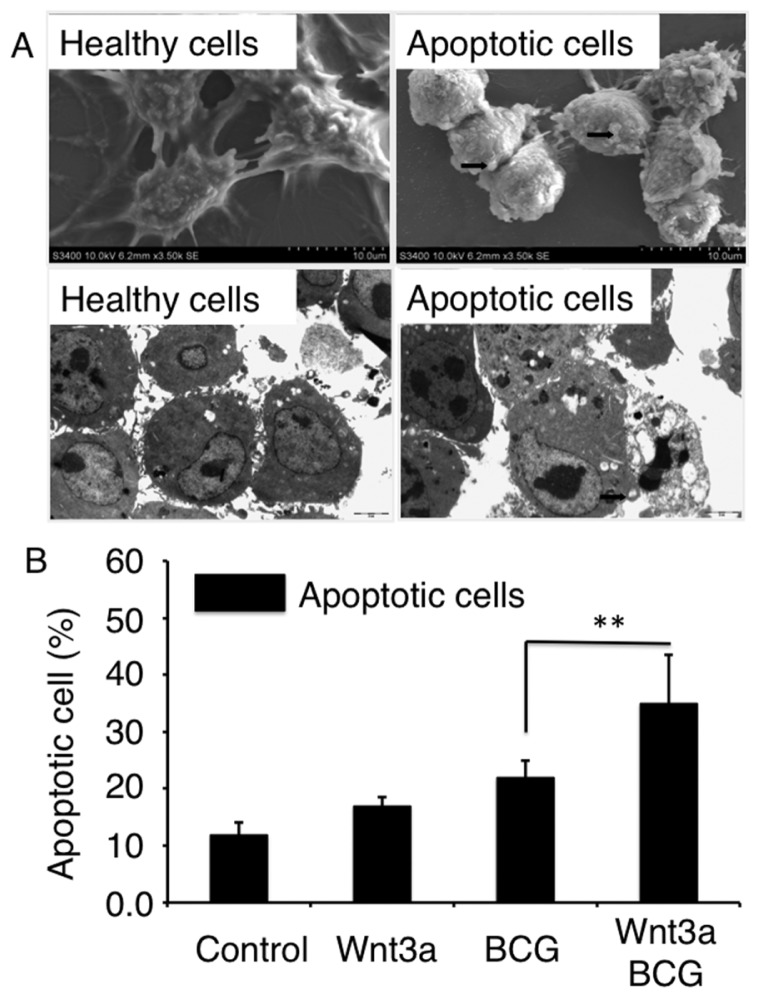
Figure 3.
Morphological analysis of the impact of Wnt3a on BCG-infected RAW264.7 cells apoptosis. RAW264.7 cells exposed to Wnt3a-CM or control-CM, followed by infection of BCG at MOI of 10 for 24 h. (A) Representative images of SEM (top panel) and TEM (bottom panel) of healthy RAM264.7 cells (left panel) and apoptotic cells (right panel); (B) Percentages of cells with an apoptotic phenotype as determined by morphology using EM images. Compared to a naïve control, ** p < 0.01. Data represented the mean ± SD from three independent triplicated experiments (n = 9). Bar in SEM images = 2 μm; Bar in TEM images = 10 μm. Arrows in A indicated apoptotic bodies.

