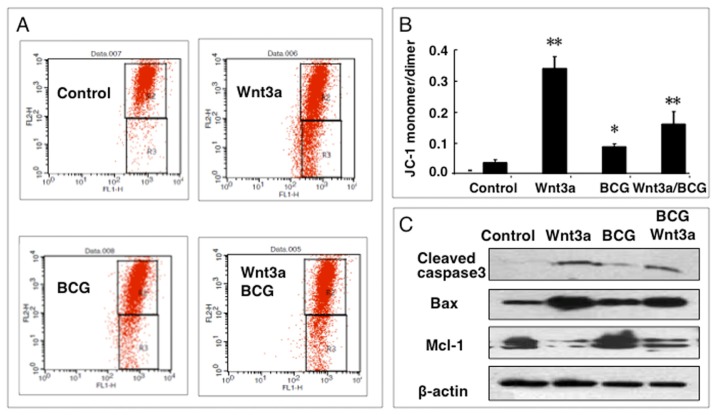
Figure 4.
Impact of Wnt/β-catenin signaling on mitochondrial membrane potential (ΔΨm) of RAW264.7 cells. (A) Representatives of dot plot of flow cytometry analysis for ΔΨm of cells treated with indicated condition for 12 h; (B) fractions of cells with low ΔΨm treated with indicated conditions for 12 h; (C) Immunoblots of apoptosis-related proteins in RAW264.7 cells treated with indicated conditions for 24 h. Compared to a naïve control, * p < 0.05; ** p < 0.01. Data represented the mean ± SD from three independent duplicate experiments (n = 9).

