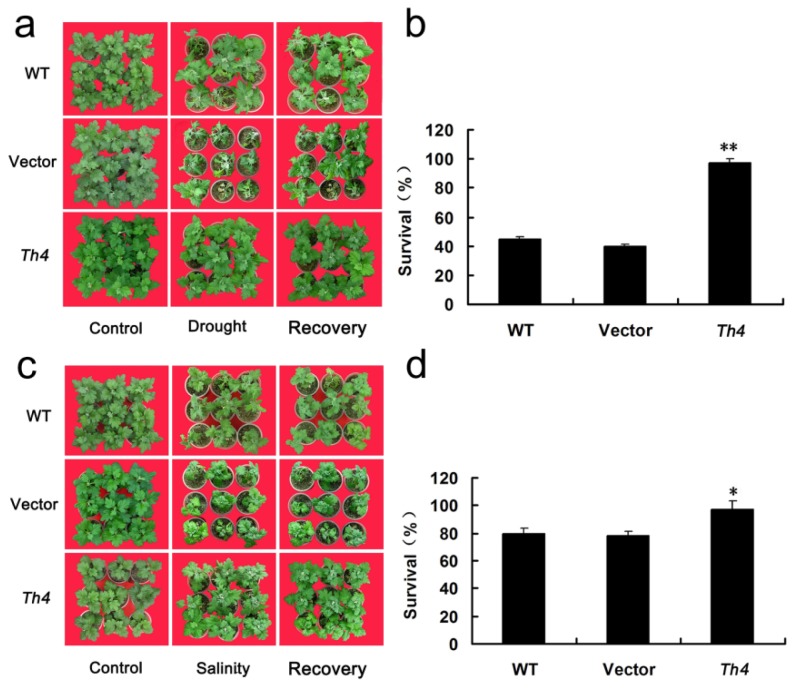
Figure 7.
The drought and salinity tolerance of transgenic chrysanthemum. (a) The appearance of WT, EV and Th4 plants subjected to a 24 days period of no watering, and during the recovery period; (b) The survival rate of WT, EV and Th4 after a two-week recovery period. Error bars based on three replicates. Mean performances differing significantly from the WT and EV performance, as derived from a Tukey’s test, indicated by asterisks (** p < 0.01); (c) The appearance of WT, EV and Th4 plants subjected to salinity stress and during the recovery period; (d) The survival rate of WT, EV and Th4 after a two-week recovery period. Error bars are based on three replicates. Mean performances differing significantly from the WT and EV performance, as derived from a Tukey’s test, indicated by asterisks (* p < 0.05).

