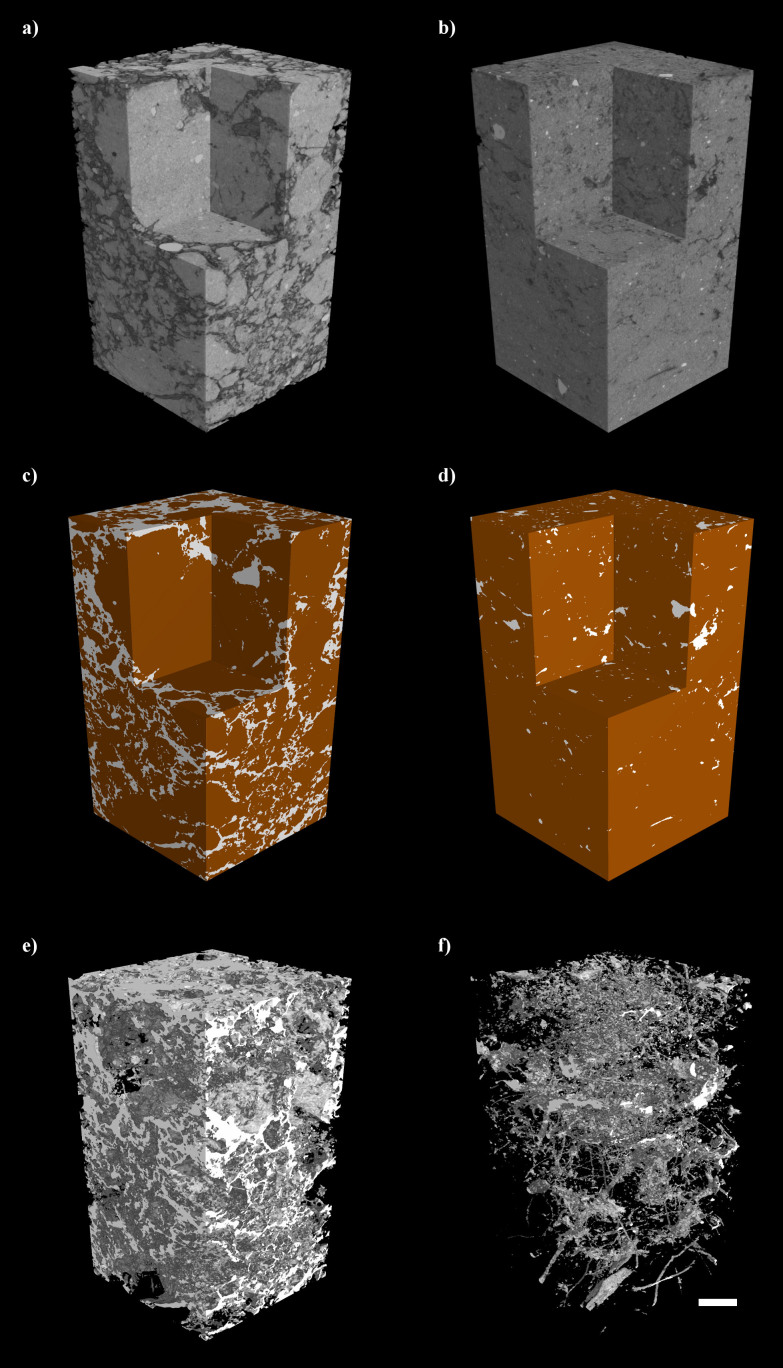
Figure 5. Non-destructive 3-D imaging of soil by X-ray CT.
Examples of Tilled (A–C) and Zero Tilled (D–F) soils. (A&D): 3D rendered grayscale density map of soil cores showing a virtual ‘cut-out' to the revealing clear differences soil structure between the two soils. (B&E): Thresholded 3D image highlighting ‘solid' soil in brown and ‘pore' space in white. (C&F): Visualisation of pore space only highlighting high connectivity of pores in the tilled soils and the presence of numerous biopores in the zero tilled soil. Scale bar = 10 mm.

