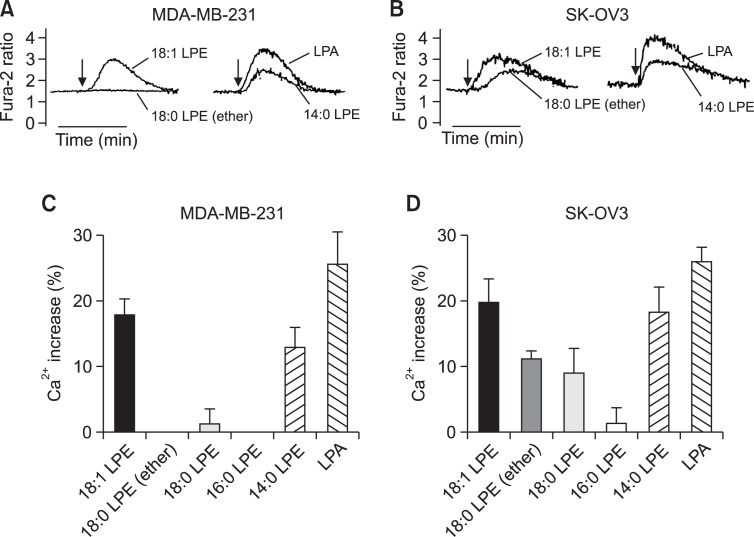
Fig. 1.
Structure-activity relationships of LPE in [Ca2+]i increases in MDA-MB-231 and SK-OV3 cells. Representative [Ca2+]i traces of MDA-MB-231 cells (a breast cancer cell line) (A) and of SK-OV3 cells (an ovarian cancer cell line) (B) treated with 10 μM of LPE or LPA. Arrows indicate when LPE or LPA was added. The data shown are representative of more than four independent experiments. Efficacies of different chain-length LPE- and LPA-induced Ca2+ responses as compared to digitonin in MDA-MB-231 cells (C) and SK-OV3 cells (D) are shown as histograms. Results are the means ± SEs of three independent experiments.

