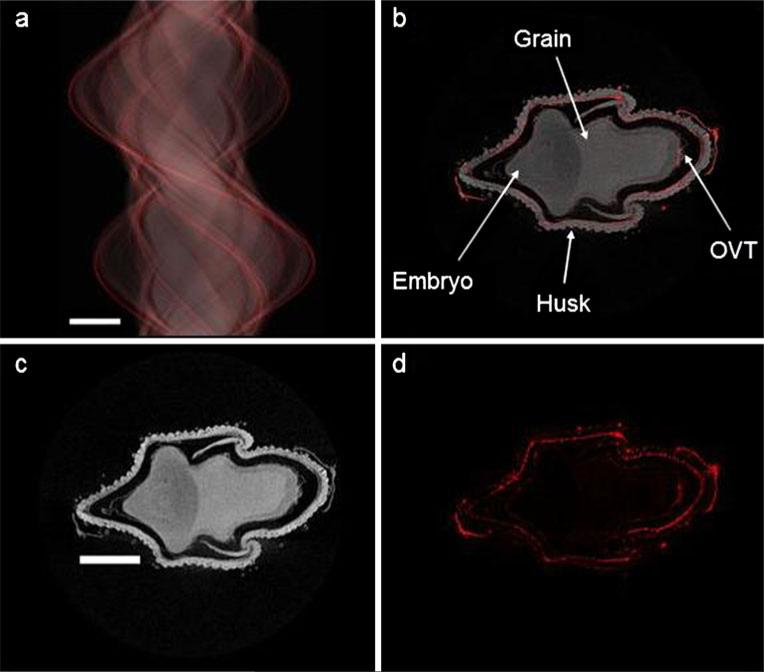
Fig. 2.
Synchrotron X-ray fluorescence microtomography images for a virtual cross section of a husked immature rice grain pulsed with 133 μmol L–1 germanic acid through the excised panicle stem. The sinogram (a) was reconstructed to generate maps of the grain density (Compton signal, c) and germanium distribution (d). Grain density and germanium distribution maps are overlain in (b). Bars are 600 μm. OVT refers to the ovular vascular trace, the point of grain entry

