Figure 5.
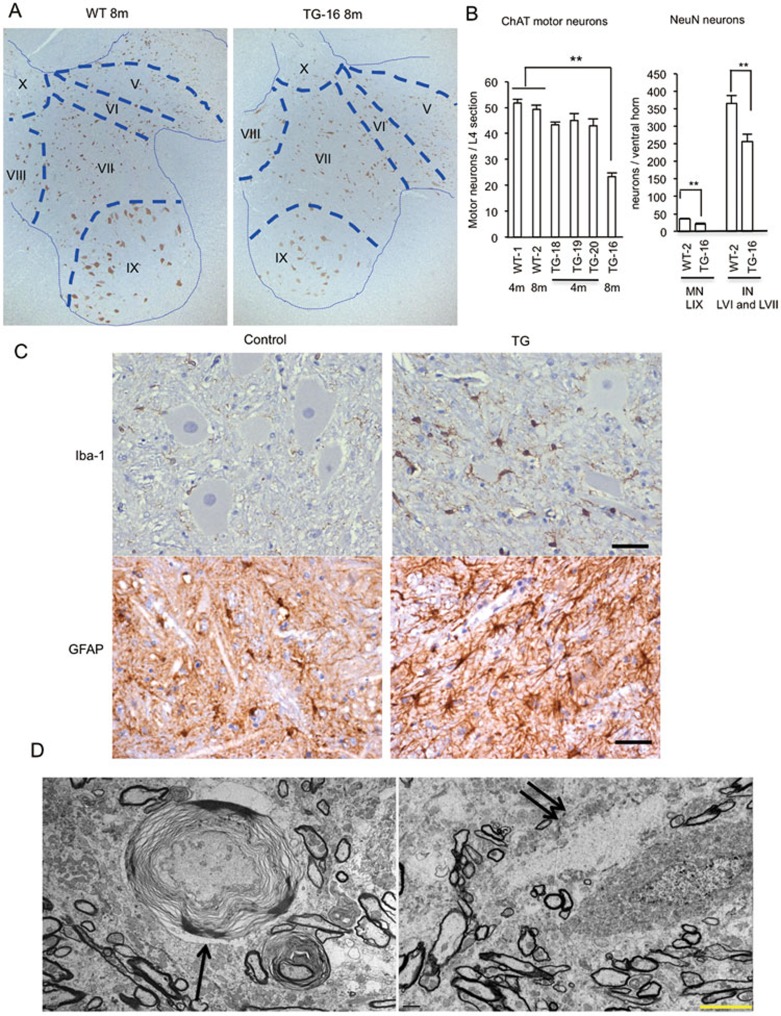
Neuropathology in hSOD1 transgenic pigs. (A) Reduced NeuN immunoreactivity is present in the ventral horn of TG-16 pig at the age of 8 months compared with the age-matched WT pig. Blue broken arrow lines define different regions in the ventral horn (LIX) and intermediate zone (LVI and LVII) of the spinal cord. (B) Quantitative assessment of the number of ChAT- and NeuN-positive cells. More data are also provided in Supplementary information, Figure S3. Data are the means ± SEM of three L4 slices; **P < 0.001, as assessed by a Student's t-test. (C) Enhanced Iba-1 and GFAP immunoreactivity indicating activated microglia and reactive astrogliosis, respectively, in the spinal cord of TG-16, but not WT, pig. (D) Electron microcopy showing demyelinating axon (arrow in left panel) and degenerated neuronal cell (double arrows in right panel) in the spinal cord of TG-16 transgenic pig. Scale bars: 50 μm in C and 5 μm in D.

