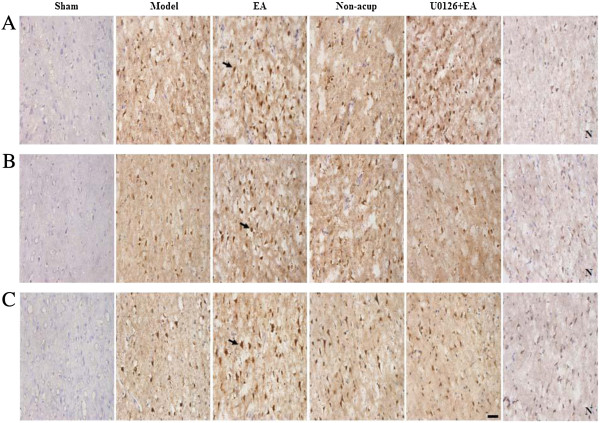
Figure 4.
Effects of EA at acupoints on pRaf-1, pMEK1/2, and pERK1/2 expression. (A) Representative photographs showed pRaf-1, (B) pMEK1/2, and (C) pERK1/2 expression in the ischemic cortex of the sham, model, EA, non-acup, and U0126 + EA groups after 3 d of reperfusion. N, negative control stain. Arrows indicate immunopositive cells. Scale bar = 50 μm.

