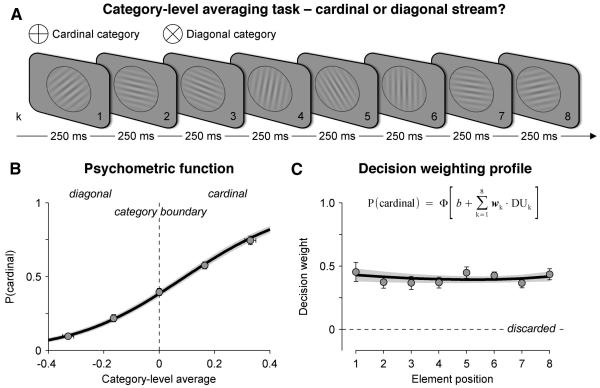
Figure 1. Experimental design and behaviour.
(A) Category-level averaging task. Rapid visual streams of eight oriented Gabor patterns were presented at a stimulation rate of 4 Hz. Participants reported whether, on average, the tilt of the eight elements fell closer to the cardinal or diagonal axes.
(B) Psychometric function relating the category-level average (x-axis), divided into five equally spaced levels, to the probability of judging the stream as being cardinal (y-axis). Dots and attached error bars indicate participants’ data (mean ± s.e.m.), the black line (and its shaded error bar indicating s.e.m) indicates the best-fitting cumulative normal function estimated via a logistic regression of choice against the category-level average.
(C) Decision weighting profile across the eight elements. Individual decision weights are estimated using a multivariate logistic regression of choice against a linear combination of the eight decision updates (inset equation). Dots and attached error bars indicate participants’ data, the black line (and its shaded error bar) indicates the best-fitting exponential profile. Same conventions as in (B).

