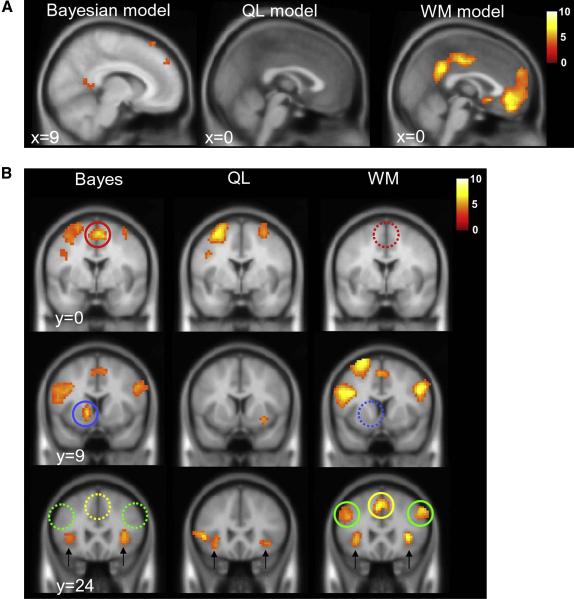
Figure 4.
A. Voxels for which BOLD signals are stronger when choice values from the Bayesian (left panel), QL (middle panel) and WM (right panel) models are higher (i.e. when the probability of a correct response is greater) rendered at a threshold of p < 0.001 onto a template brain (saggital slice). B. Voxels for which BOLD signals are stronger when choice values from the three models are lower (e.g. when p(A) is closest to 0.5, the probability of correct is lowest, and decision entropy is highest), shown on three coronal slices. Full coloured circles highlight clusters that are specific to either the Bayesian or WM models; dashed models signal the absence of the corresponding cluster for the other model (red, SMA; blue, striatum; green, anterior dorsolateral PFC; yellow, pre-SMA). Black arrows highlight activation in the anterior insula, which was present in all three condition (see also figure 5a). In both A and B, the red-white render scale indicates the t value at each voxel.

