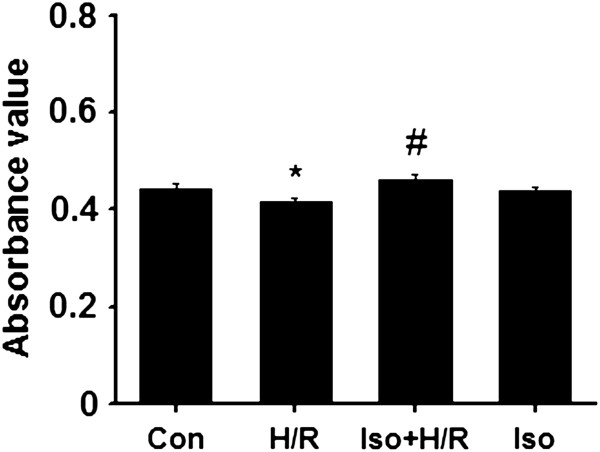
Figure 1.

Viability value of each group (n = 6). *p < 0.01, compared to the control group; # p < 0.01, compared to the H/R group. Con, control; H/R, hypoxia/reoxygenation; Iso + H/R, isoflurane plus H/R; Iso, isoflurane alone. The concentration of isoflurane was 0.4 mM.
