
Figure 5. CenH3 nucleosomes protect small DNA fragments.
(A, B, C) Normalized fragment counts in input (A), cenH3 ChIP (B) and insoluble chromatin (C) samples at centromeric sites. MNase fragments were divided into nucleosomal (141–500 bp) and small (21–140 bp) size classes. Average signals within a 1-kb window around all 707 cenH3 sites are plotted. Dashed lines mark the centers of the flanking nucleosomes in (A) (black lines) or the centromeric nucleosome in (B) (blue line) and in (C) (magenta line). (D) Cartoon illustrating how MNase fragment size distributions shown in (E and F) were determined. Fragments that cross the center of the cenH3 nucleosome or of the flanking nucleosomes were counted. (E and F) MNase fragment size distribution after 2 min (E) and 10 min (F) of MNase digestion. Input fragments at flanking nucleosomes (black) and cenH3 ChIP fragments (blue) and insoluble chromatin fragments (magenta) at centromeric nucleosomes are shown. Cartoons of the protected particles are shown below each panel. (G and H) Comparison of worm holocentromere and budding yeast point centromere. (G) C. elegans holocentromere. Centromere model and cenH3 ChIP over input ratio (all size classes; left y-axis) and nucleosomal signal from input (141–500 bp; right y-axis). Average signals within a 1-kb window around all 707 cenH3 sites are shown. (H) Budding yeast point centromere. Centromere model and data from Krassovsky et al. (Krassovsky et al., 2012), cenH3 ChIP over input ratio (left y-axis) and input signal (right y-axis) from all 16 centromeres.

Figure 5—figure supplement 1. Comparison of input signal at centromeric sites in native and formaldehyde-crosslinked samples.
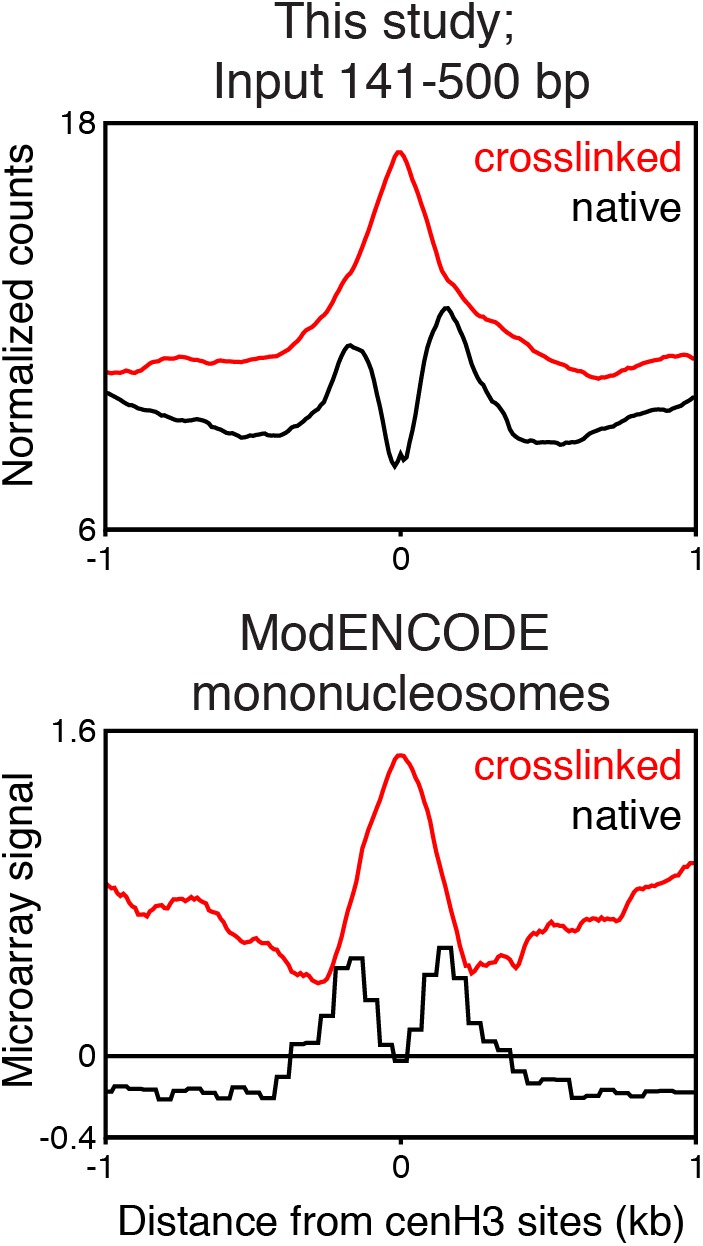
Figure 5—figure supplement 2. Fragment size distribution for different degrees of MNase digestions.

Figure 5—figure supplement 3. Particle size estimation from overdigested insoluble chromatin.
