
Fig. 3.
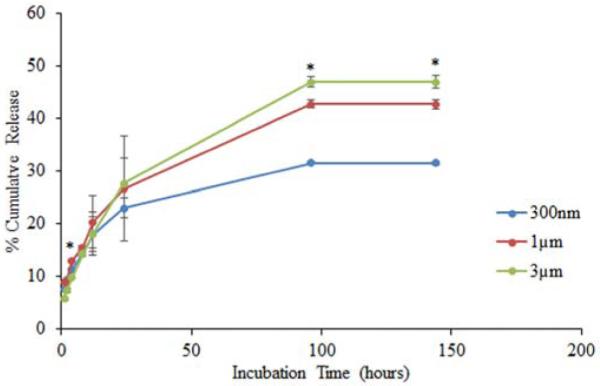
Effect of chitosan particle size on protein release. 300nm, 1 μm, and 3 μm chitosan particles encapsulating 100μg FITC-BSA were incubated with PBS. Samples were collected at each time point and protein release was quantified by measuring florescence using spectroflourometer. Each data point represents the mean of 4 independent samples. * indicates a statistically significant difference in cumulative release among the different chitosan particle sizes (P ≤ 0.05).