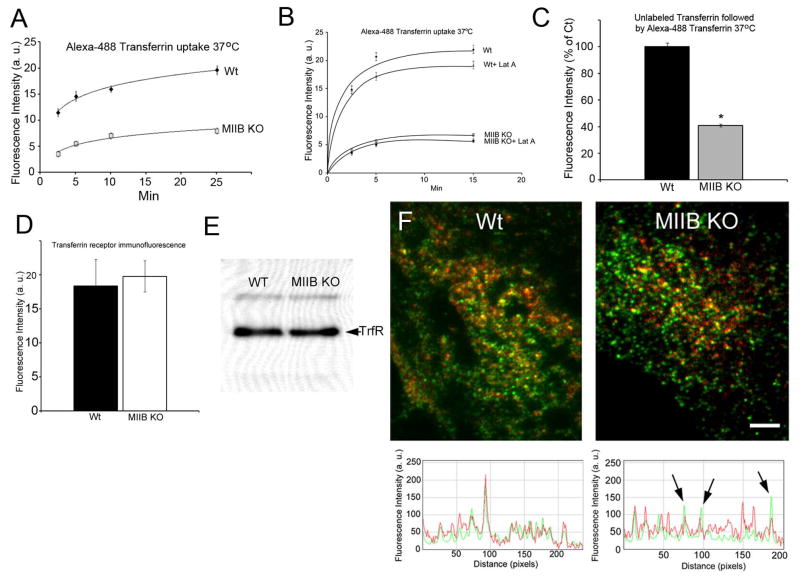
Figure 2.
Steady state transferrin uptake is defective in MIIB KO fibroblasts and can also be influenced by latrunculin A treatment; transferrin receptor levels are normal. (A) Comparison of Alexa-488 transferrin uptake in Wt and MIIB KO cells incubated with the label at 37 °C. Cells were rinsed and then fixed at the indicated times. MIIB KO cells had lower fluorescence at every time point. Both Wt and MIIB KO cells appear to reach a steady state between internalization and processing (exocytosis of fluorescent transferrin) at about 25 min. N values (cells) at the different time points (2.5, 5, 10, 25 min) from 3 experiments, Wt= 204, 135, 152, 130, MIIB KO=140, 166, 115, 145. (B) Treatment with a low concentration of latrunculin A (250 nM) reduces the uptake of transferrin in both Wt and MIIB KO cells. Cells were pre-incubated with latrunculin A for 30 min at 37 °C (without serum starvation) and then incubated with Alexa-488 conjugated transferrin (± latrunculin A) for the indicated times at 37 °C. The cultures were washed with the acidic iron chelation solutions prior to fixation. Wt cells showed a significant decrease in transferrin uptake at both 5 and 15 min (t-test, P<0.001, N≥70 cells per time point). MIIB KO cells showed a significant decrease in transferrin uptake at 15 min (t-test, P=0.02, N≥70 cells per time point).(C) MIIB KO cells show decreased capacity to bind and internalize dye labeled transferrin after initial loading with unlabeled transferrin. Cells were incubated at 37 °C for 15 min with unlabeled transferrin (100 μg/ml), rinsed and then labeled at 37 °C with Alexa-488 transferrin for 10 min. Cells were rinsed 4× and then fixed. Wt cells are more than 2× brighter indicating a much higher capacity to bind and internalize labeled transferring after binding and processing unlabeled transferrin. Difference was significant (t-test, P<0.001, Wt, N=121, MIIB KO, N=118). (D) Comparison of transferrin receptor immunofluorescence labeling (without transferrin labeling or serum starvation). Cells were labeled with an antibody to the transferrin receptor and then imaged by TIRF microscopy. There was no difference in the brightness between Wt and MIIB KO cells. (t-test, P=0.8, N=10 cells each). (E) An immunoblot of the transferrin receptor. Equal amounts of protein were loaded in each lane. The bands were of equivalent intensity. (F) Dual channel TIRF microscopy of transferrin receptor immunofluorescence (green) and biotin transferrin (red) from cells fixed after 5 min at 37 °C. RGB line profiles of lines drawn diagonally (left to right) through the images are shown below the TRIF images. In the Wt, spots show good correspondence between intensities in both channels. In the MIIB KO cells some receptor spots show relatively low levels of transferrin label (arrows). Bar=8 μm.

