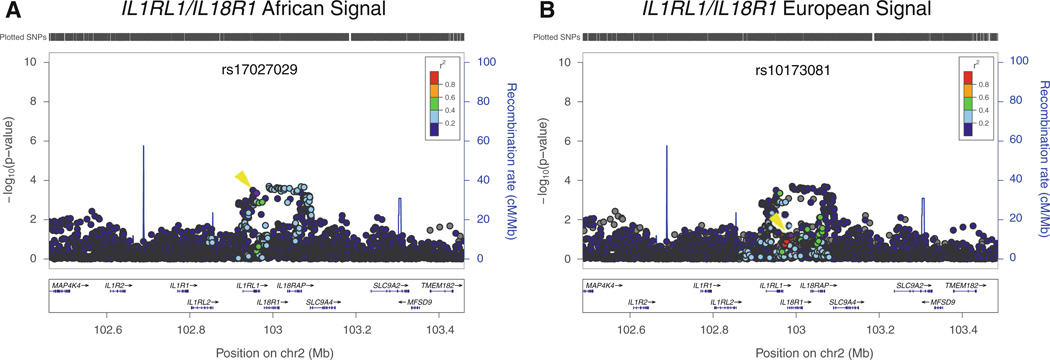
Fig. 3.
Fine mapping of association results at ILlRLl/IL18R1 locus. Association results in the CARe African-American samples with LD estimated either in African ancestry individuals (a) or European individuals (b) plotted using LocusZoom (Pruim et al. 2010) against the position on chromosome 2. The purple dot (also marked with a yellow arrowhead) represents the most significantly associated SNP after meta-analysis (rs17027029 for African-Americans and rsl0173081 for Europeans). The SNPs surrounding the most significant SNP are color coded to reflect their LD with this SNP. Estimated recombination rates are plotted in cyan to reflect the local LD structure. Genes, the position of exons, and the direction of transcription from the UCSC genome browser are noted. Hashmarks represent SNP positions available in the meta-analysis (color figure online)

