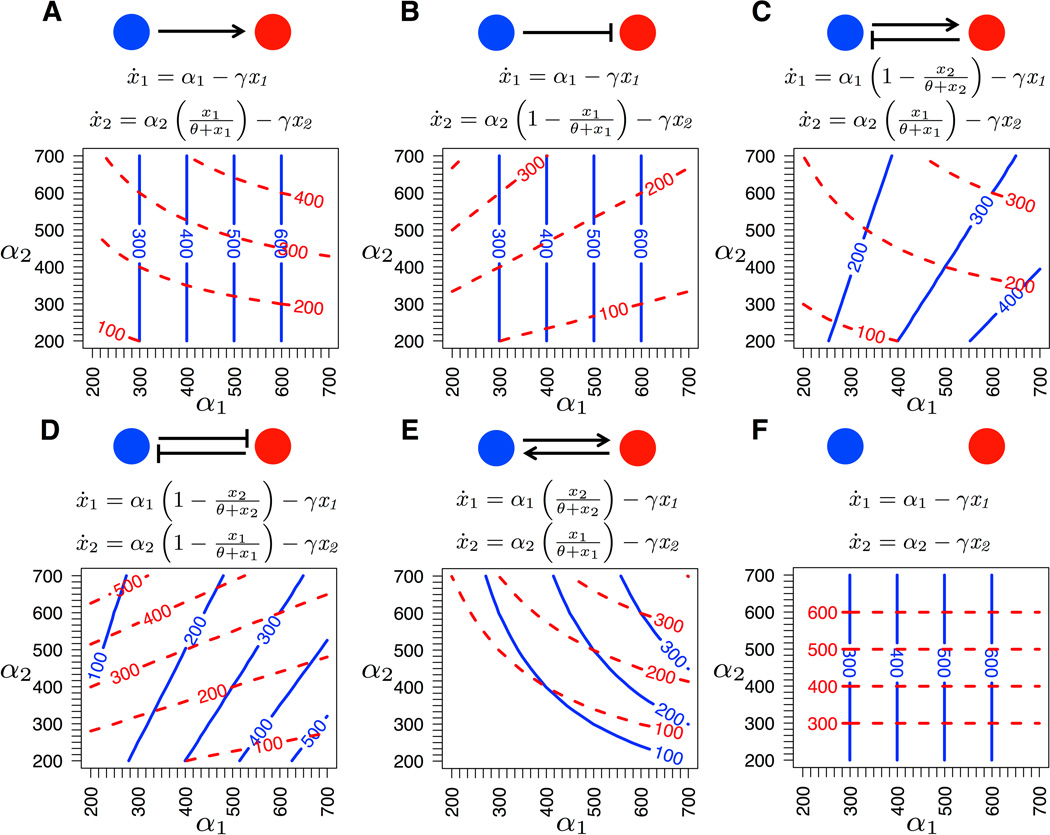
Figure 1.
Gene regulatory network motifs. Below each motif are the system of ordinary differential equations governing gene expression levels xi and a graphical depiction of the genotype-phenotype map. Parameters are genotypic value αi, the sum of allelic values at locus i; θ, concentration of the regulator at which half of the maximum activation level is reached; and γ, gene product decay rate. All motifs reach a single stable equilibrium gene expression level given a pair of genotypic values. Contours represent these phenotypic trait values x1 (solid blue) and x2 (dashed red) as a function of genotypic values.

