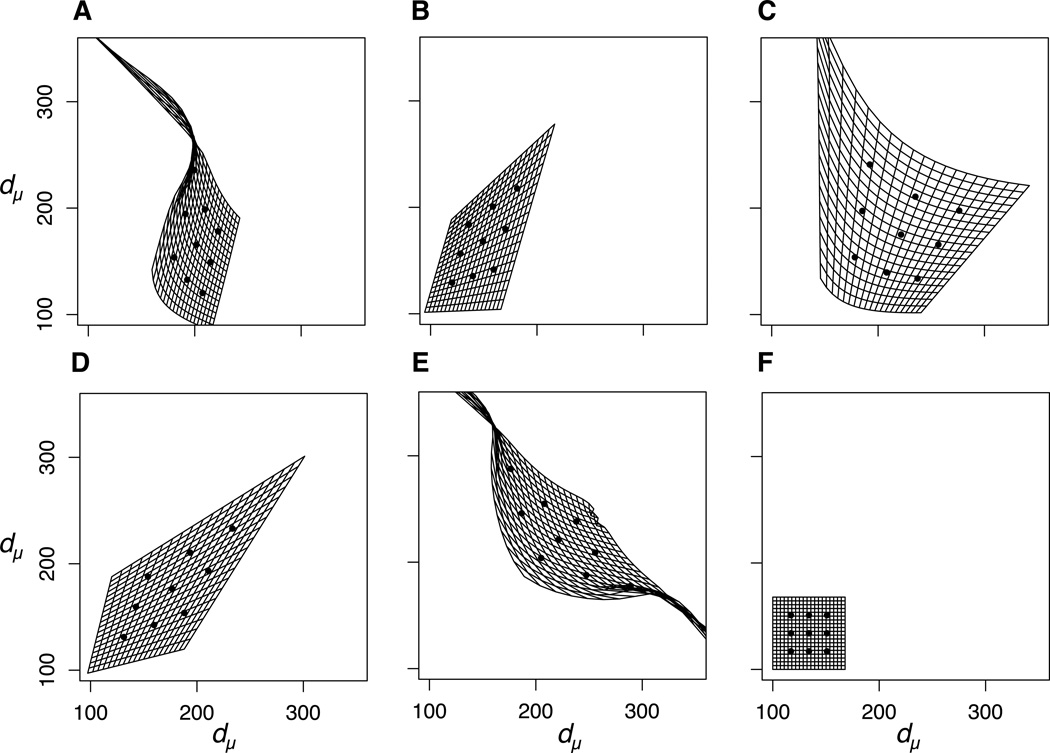
Figure 3.
Phenotypic space re-scaled by mutational (co)variance for each motif. Phenotypic values from 100–500 are represented as a grid that is deformed such that distances between phenotypes, dμ, in this new depiction represent equal amounts of mutational variation. For visual reference, the locations of the nine populations from Figure 2 are plotted as black dots in this new mutational space. Note that this re-scaling may cause the 2-dimensional phenotypic space to curve outward into higher dimensions, but it is represented here as the projection of this curved manifold onto a plane.

