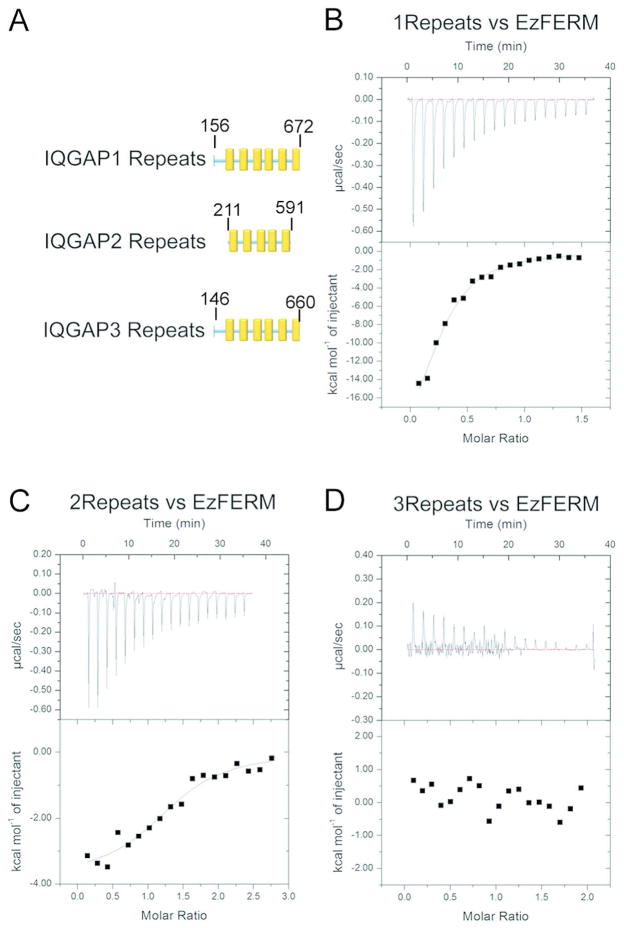
Figure 3. Representative ITC data for IQGAP Repeats and EzFERM.
Titrations were conducted at 23°C using an ITC200. Repeats were the titrant and EzFERM was in the cell. (A) Schematic diagram of Repeats fragment constructs used in this study. (B) 1Repeats. (C) 2Repeats. (D) 3Repeats. B–D, Each panel shows the raw ITC data (top) and the integrated heats (bottom) after subtraction of any heats arising from injection of titrant into buffer alone.

