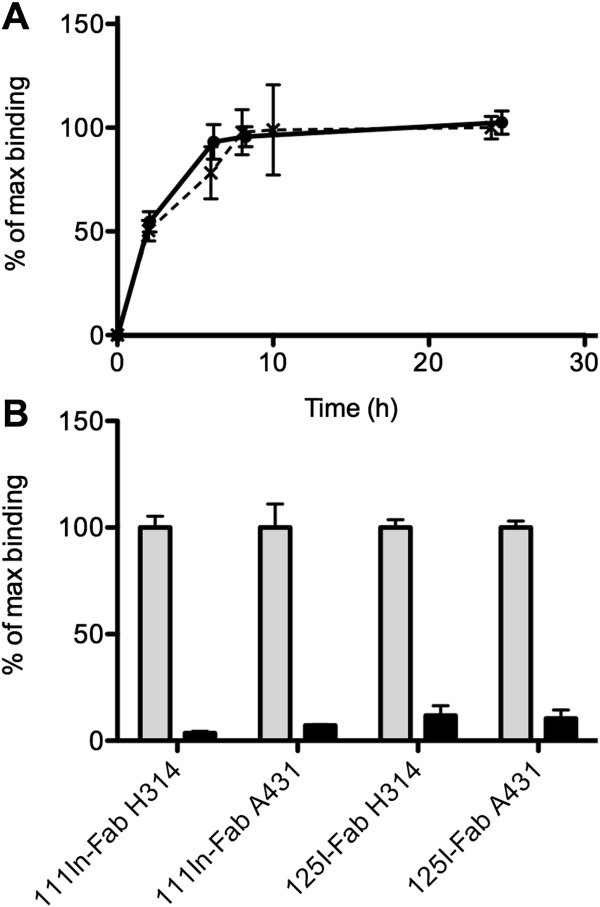
Figure 2.

Cellular uptake (A) and specificity (B) of 111In-Fab and 125I-Fab in cultured cells. (A) Cellular uptake of 111In-Fab (straight line) and 125I-Fab (broken line) during incubation for 0 to 24 h in H314 cells. Error bars represent SD (N = 3 to 6). (B) Specificity of 111In-Fab and 125I-Fab in H314 and A431 cells. Grey bars show uptake in unblocked cells, whereas black bars show uptake in cells blocked with an excess of unlabelled AbD15179. Error bars represent SD (N = 3 to 8).
