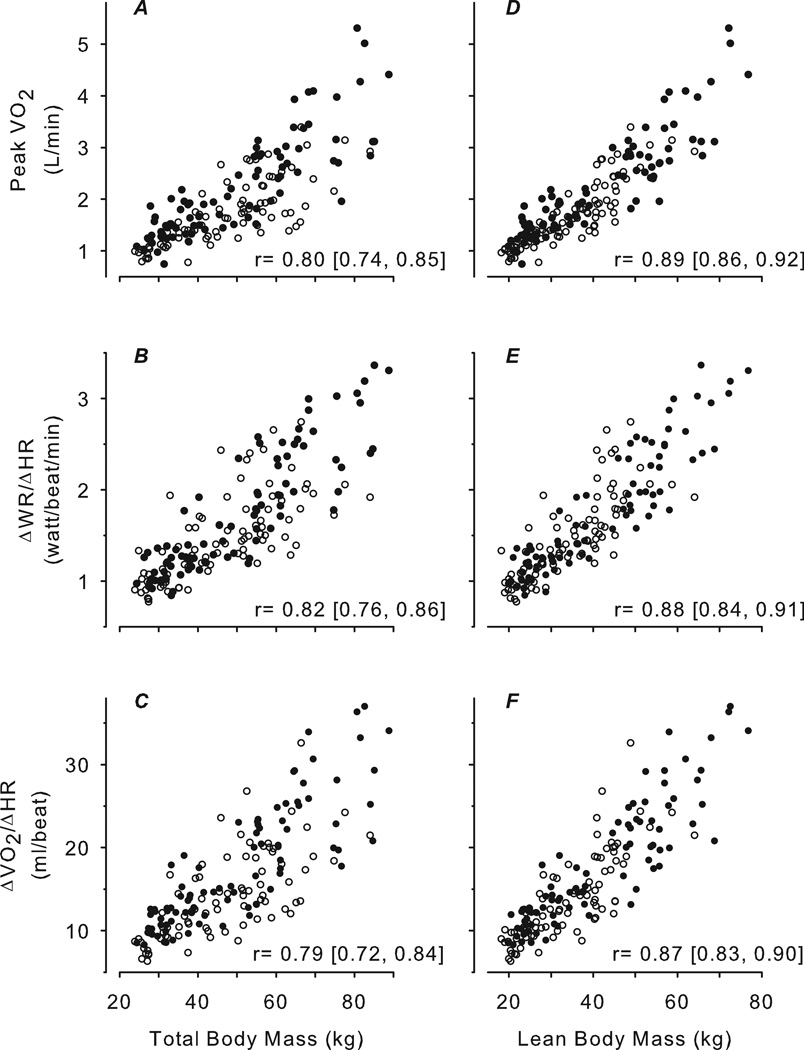
Figure 3.
Scatter plots of CPET variables predicted to be relatively body size-dependent versus TBM determined by standard scale (A, B, C) and LBM determined by DXA (D, E, F). Females are shown as open circles, males as closed circles. The correlation and corresponding 95% CI are shown for each plot. In all cases, the correlations with TBM were high but were significantly improved with LBM.

