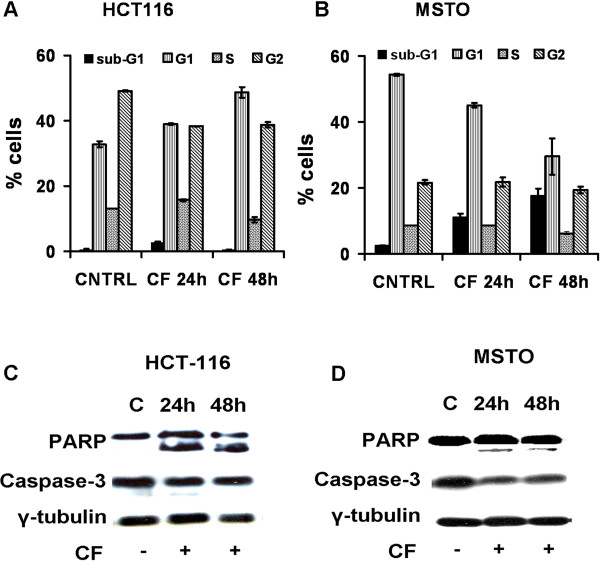
Figure 3.
Effects of CF on the HCT116 and MSTO cell-cycle progression and apoptosis. Cell cycle analysis after propidium iodide staining was performed by flow cytometry in HCT-116 and MSTO cells untreated (CNTRL) or treated with CF (1:200) for 24 and 48 h (CF24 h and CF48 h). The percentages of HCT-116 and MSTO cells in the different phases of cell cycle was reported in graph (A) and (B), respectively. Data are expressed as mean ± SD of at least three independent experiments. Western blot of total lysates indicates that the CF activates caspase-3 and PARP cleavage in HCT-116 (C) and MSTO (D) cells upon CF treatment (1:200) for 24 and 48 h versus the untreated control (C). γ tubulin was examined as a loading control. The image represents three independent experiments.

